USDA Reports Review
Soybeans Plunge, Wheat Rallies on USDA Stocks and Production Changes
USDA's Sept. 1 Grain Stocks and Small Grains Summary reports featured a bearish revision to the 2020 soybean crop, along with a higher-than-expected Sept. 1 stocks number for both soybeans and corn. Wheat production and stocks were both construed as bullish.
Here's a closer look at some of the changes seen in the reports:
CORN
U.S. corn's Sept. 1 stocks were revealed to be higher than expected at 1.236 billion bushels (bb), some 69 million bushels (mb) above the average trade estimate of 1.167 bb. Still, the Sept. 1 stocks declined 36% from the 1.919 bb stocks in September 2020. While the stocks number was certainly regarded as bearish, the 71-mb downward revision in 2020 production was a positive input, as yield fell by 0.6 bushels per acre (bpa) to 171.4 bpa, and both planted and harvested acres were revised downward to 90.7 million acres (ma) and 82.3 ma, respectively, with the latter figure 200,000 ma below the last report.
Of the Sept. 1 stocks, on-farm stocks were 395 mb and down 47% from last year, while off-farm stocks were down just 28% at 842 mb. The June through August indicated disappearance figured to be 2.87 bb compared to 3.08 bb a year ago.
Dow Jones' pre-report trader survey had expected stocks to come in at a much lower 1.167 bb, so the market regarded the stocks number as bearish, with December corn down 12 cents at one point. But a late-session rally brought corn futures back, close to unchanged. The slightly higher-than-expected stocks number did little to change the still-tight corn stocks situation, especially with early new-crop yields coming in lower than expected in some key Corn Belt states.
P[L1] D[0x0] M[300x250] OOP[F] ADUNIT[] T[]
SOYBEANS
Soybeans is where the real surprise came. Sept. 1 soybean stocks, estimated to come out little changed at 172 mb, actually rose to 256 mb. While that is still down over 51% from a year ago, it figured to be 84 mb higher than the average trade estimate. Adding to the bearishness was the revised soybean production for 2020, as yield was increased by 0.8 bpa to 51 bpa, and planted and harvested acres were both revised higher. Harvested acres were increased by 100,000 acres. The result was that soybean production rose by 81 mb compared to the previous estimate.
Of the Sept. 1 stocks, on-farm stocks were 68.1 mb, down 52% versus a year ago, while off-farm stocks, at 188 mb, were down 51% from a year ago. June through August indicated disappearance figured 513 mb, down 40% from a year ago.
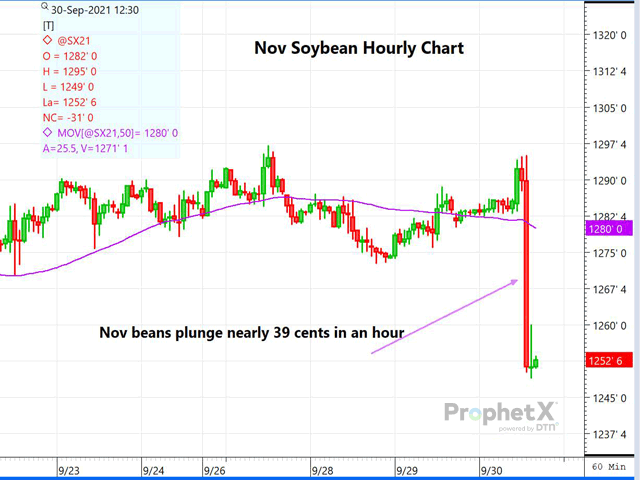
Prior to the report, November soybeans were trading up 2 cents. Following the report, they fell as much as 35 cents at one point before finishing down 27 3/4 cents.
The report surely loosened up the once very tight balance sheet for soybeans.
WHEAT
The wheat market on Thursday got a double dose of bullish news to drive values higher by the close. Sept. 1 all wheat stocks were reported to be 1.78 bb, down 18% from a year ago but also 79 mb below the average pre-report estimate. Of that stocks total, on-farm stocks figured to be 419 mb, 41% lower than a year ago, while off-farm stocks of 1.36 bb were down just 6% from a year ago. June through August disappearance was revealed to be 711 mb, 2% higher than a last year.
All wheat production, estimated to be 1.681 bb, instead came out at 1.646 bb, down 51 mb from August and down a hefty 180 mb from a year ago. Winter wheat production, estimated to be 1.32 bb, instead fell to 1.28 bb and down sharply from the 1.319 bb August number. Other spring wheat came out close to pre-report expectations, at 331 mb, down from 343 mb in August; that was down 44% versus a year ago. Harvested acres of other spring were revised lower to just 10.2 ma compared to the 11.6 ma planted number, as abandonment reached 11%. Yields on winter wheat declined to 50.2 bpa from 50.9 bpa a year ago, while spring wheat yield plunged from 48.6 bpa to just 32.6 bpa.
Prior to the report, all three wheat markets were trading 7 to 8 cents higher, but after the report, Kansas City December futures rallied to close 20 cents higher.
FINAL THOUGHTS
The net effect of the Sept. 30 quarterly Grain Stocks and Small Grains Summary reports was to tighten up the wheat balance sheet even further while loosening up the corn and soybean balance sheets. Soybeans took center stage as last year's production and September stocks were both revised higher, sending soybeans to sharp losses.
Dana Mantini can be reached at dana.mantini@dtn.com
Follow Dana Mantini on Twitter @mantini_r
(c) Copyright 2021 DTN, LLC. All rights reserved.


