USDA Cattle on Feed Report
Jan. 1 Cattle on Feed Up Slightly
This article was originally posted at 2:03 p.m. CDT on Friday, Jan. 22. It was last updated at 2:44 p.m. on Friday, Jan. 22.
**
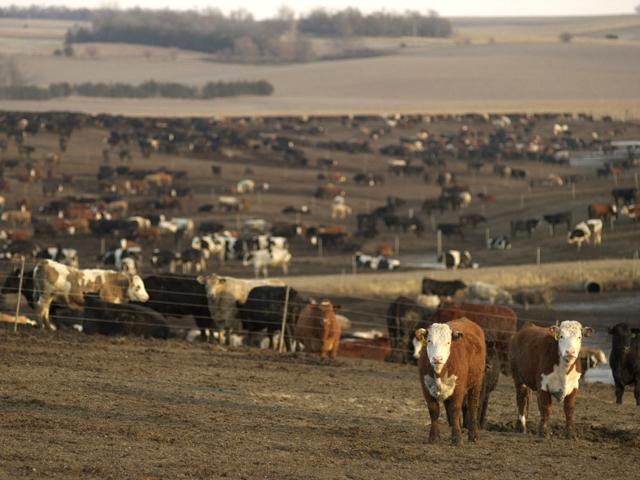
OMAHA (DTN) -- Cattle and calves on feed for the slaughter market in the United States for feedlots with capacity of 1,000 or more head totaled 12.0 million head on Jan. 1, 2021. The inventory was slightly above Jan. 1, 2020, USDA NASS reported on Friday.
The inventory included 7.40 million steers and steer calves, up slightly from the previous year. This group accounted for 62% of the total inventory. Heifers and heifer calves accounted for 4.57 million head, down slightly from 2020.
P[L1] D[0x0] M[300x250] OOP[F] ADUNIT[] T[]
Placements in feedlots during December totaled 1.84 million head, 1% above 2020. Placements were the second highest for January since the series began in 1996. Net placements were 1.78 million head. During December, placements of cattle and calves weighing less than 600 pounds were 460,000 head, 600-699 pounds were 435,000 head, 700-799 pounds were 425,000 head, 800-899 pounds were 317,000 head, 900-999 pounds were 110,000 head, and 1,000 pounds and greater were 95,000 head.
Marketings of fed cattle during December totaled 1.85 million head, 1% above 2020. Marketings were the second highest for January since the series began in 1996.
Other disappearance totaled 60,000 head during December, 10% below 2020.
DTN ANALYSIS
"Why does it seem like every time the market closes sharply higher and has the industry on the edge of its seat waiting for a highly anticipated bullish report to be shared that bearish news ends up creeping into the marketplace? Surprise, surprise! Friday's Cattle on Feed report did not unveil what analysts projected whatsoever and ended up showing higher placement figures for the month of December 2020," said DTN Livestock Analyst ShayLe Stewart.
"Cattlemen and feedlots alike were praying that the report would yield lighter placement numbers and ultimately be added to the last two reports that also showed lighter placement figures. But, most importantly, lighter placements mean that, later, tighter fed cattle supplies will most likely be found, which can help feedlots regain some market share and greater profitability.
"Conversely, higher placements mean greater placements could be found later down the road, which can pressure the market's supply and cause prices to fall lower. When looking at the data shared in Friday's report, it's important to keep a couple of things in mind.
"First, placements were up a mere 1% -- not 2%, not 5%, but simply 1%. Following two months of lighter placements, we must understand that, at some point, cattle were going to start working their way back into the feedlots and would end up being accounted for on this report.
"Secondly, putting aside what we all hated about 2020, the fact remains that, with unmatched consumer demand, beef slaughter speeds were commendable throughout the year. On a per head basis, only roughly 3.5% fewer cattle were processed in 2020 than in 2019 even with reduced slaughter speeds throughout the spring and the lack of the food service industry. So, when December came around and feedlots were happy to market their heavier cattle to packers instead of carrying them into the New Year, that allowed for more bunk space to become available and ultimately led to higher placements.
"In conclusion, Friday's Cattle on Feed report took the market by surprise, as higher placements weren't even considered an option earlier in the week. After the market takes in the initial shock of 'higher placements,' there is still enough technical and fundamental support working in the market's favor that this report shouldn't crumble the market to its core."
**
DTN subscribers can view the full Cattle on Feed reports in the Livestock Archives folder under the Markets menu. The report is also available at https://www.nass.usda.gov/….
| USDA Actual | Average Estimate | Range | |
| On Feed Jan. 1 | 100% | 99.3% | 98.8-99.9% |
| Placed in Dec. | 101% | 97.0% | 93.0-100.0% |
| Marketed in Dec. | 101% | 100.7% | 100.3-101.8% |
(c) Copyright 2021 DTN, LLC. All rights reserved.


