USDA Reports Review
Corn and Soybean Markets React to Bearish WASDE Data
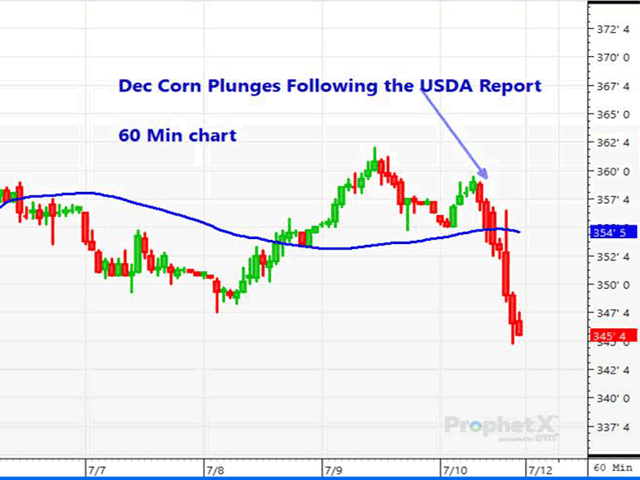
The USDA Crop Production and World Agricultural Supply and Demand Estimate (WASDE) reports, released Friday, July 10, had a bearish reaction in the markets. In the corn and soy markets, USDA sliced domestic demand, leading to higher-than-expected beginning stocks for 2020-21. Demand for corn was also lowered in the 2020-21 crop year. The cuts in demand led to speculation that, if COVID-19 continues to hamper the U.S. economy, we could see further demand cuts down the road.
CORN
Following the surprisingly large 5-million-acre (ma) cut from the March planting intentions report, traders expected a crop of 15.06 billion bushels (bb), according to Dow Jones' pre-report estimate. That estimate was close to Friday's report number of 15 bb with a 178.5-bushel-per-acre (bpa) yield. However, as feed and residual use was cut by 100 million bushels (mb) to 5.6 bb, and corn used for ethanol was slashed by 50 mb to 4.850 bb, 2019-20 ending stocks rose to 2.248 bb, up 145 mb from the June report. Feed and residual use was also reduced by 200 mb for 2020-21, and was only partially offset by a 25 mb rise in food, seed and industrial use, leading to a 2.648 bb ending stocks number, or a decline of 675 mb from the June report. The fear is that, without COVID-19 under control, we could see the ethanol number again decline by 100 mb or more in future reports.
On the world front, there were few changes that were not attributable to U.S. corn, with Brazil and Argentine corn production unchanged at 101 million metric tons (3.97 bb) and 50 mmt (1.97 bb), respectively. World ending stocks for 2020-21 fell by a greater-than-expected 22.8 mmt (897 mb), due to the decline in U.S. production to 315 mmt (12.4 bb).
The average farmgate price for corn was increased by 15 cents per bushel from June to $3.35.
December corn was roughly 3 1/2 cents lower prior to the report but closed down 12 1/4 cents to $3.44 3/4.
P[L1] D[0x0] M[300x250] OOP[F] ADUNIT[] T[]
SOYBEANS
USDA reported soybean production at 4.135 bb -- less than the 4.167 bb Dow Jones average estimate. That is up 10 mb from the June report, largely due to a 200,000 acre increase in harvested acres at 83 ma. Yield remained unchanged at 49.8 bpa.
A 25-mb cut in 2019-20 export demand, as well as higher crush and lower residual use, resulted in a 2019-20 ending stocks number of 620 mb. That's up 35 mb from the June report and 31 mb higher than the Dow Jones pre-report estimate. The higher carry in stocks and a rise in crush to a record-large 2.160 bb, resulted in a 2020-21 soybean ending stocks number of 425 mb, 30 mb higher than in June.
World soybean stocks, at 95.1 mmt (3.49 bb), came in 1.2 mmt lower than the June report and 2.6 mmt lower than traders estimated. Notable changes were an increase of 2 mmt in Brazil's soybean crop to a record-large 126 mmt (4.63 bb). China soy imports were raised by 2 mmt to 96 mmt (3.53 bb), and crush was increased by 1 mmt. Brazil's soybean exports were increased by 4 mmt to 89 mmt (3.27 bb).
Prior to the report, November soybeans were down 2 cents, but finished down 10 3/4 cents for the day. The farmgate price for soybeans was raised by 30 cents to $8.50 per bushel compared to June.
WHEAT
All-wheat production was lowered by 53 mb from the June report to 1.824 bb, which is less than the trade had expected. Winter wheat was pegged at 1.22 bb, down 48 mb from June, with a small change in yield to 52 bpa. Hard red winter wheat was reduced from 743 mb to 710 mb, and down 120 mb from last year. Soft red winter fell by 17 mb to 280 mb, but is up 41 mb from a year ago. Other spring wheat came in at 550 mb -- down from 562 mb a year ago. Hard red spring wheat was pegged at 502 mb.
Ending stocks of wheat, due to higher June 1 stocks, came in at 1.042 bb, compared to 983 mb in June. The higher carry in stocks, along with a 10-mb decline in feed and residual, resulted in a 2020-21 ending stocks estimate of 942 mb -- 17 mb higher than in June.
On the world front, global ending stocks were pegged at a record-large 314.8 mmt (11.57 bb), but down 1.3 mmt from the June estimate. Notable changes were a drop of 1.5 mmt in the EU wheat crop to the lowest level since 2012-13 and a 500,000 mt decline in the Russian wheat crop to 76.5 mmt. World consumption of wheat was reduced by 1.6 mmt due to lower feed and residual use. China holds an estimated 51% of the record-large world stocks.
Kansas City wheat was trading 2 cents lower prior to the report but closed the day 4 3/4 cents lower. Export competition for U.S. wheat exports will continue to be a challenge in 2020-21.
Dana Mantini can be reached at dana.mantini@dtn.com
Follow Dana Mantini on Twitter @mantini_r
(c) Copyright 2020 DTN, LLC. All rights reserved.


