

Kub's Den
Ethanol Data and the Great American Road Trip
A family from Florida, obviously out of place at an Iowa gas station along the interstate, but cheerfully looking forward to the next game of "I Spy" from the backseat of their Tahoe; travelers from Chicago, stopping to take selfies with a "Lewis & Clark Trail" roadside sign; rental RVs, headed west; kayaks strapped to the roofs of SUVs -- these were a few signs of summertime normalcy I observed while on my own little road trip, delivering some furniture to my sister. (That was my excuse, if I needed one, to break out from my COVID restlessness and see how the Western Corn Belt crops were looking.) I was careful to never touch the door handles at any rest stops and to use hand sanitizer after fueling up. But I was not alone out there on the road -- the Great American Road Trip isn't dead!
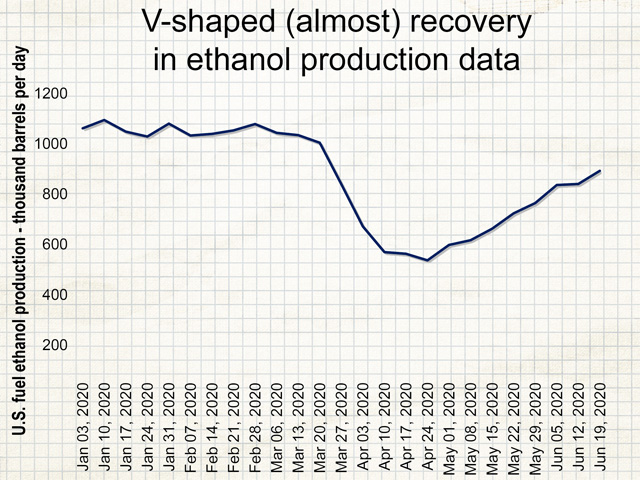
We can look to the remarkable recovery in the ethanol industry to emphasize this point. During the eight weeks through March and April, while everyone in the economy was grappling with how best to limit human contact to slow the spread of a deadly disease, American ethanol production was steadily dropping at an average pace of 9% each week. The U.S Energy Information Administration publishes weekly figures of U.S. production of fuel ethanol and the nadir of that data series came from the week of April 24: only 537,000 barrels per day. That was about half of a pre-COVID "normal," like the 1.079 million barrels per day from the week of February 28, 2020.
P[L1] D[0x0] M[300x250] OOP[F] ADUNIT[] T[]
Such volatility in ethanol production was unheard of. The industry typically has a fairly stable, predictable output. The maximum weekly figure ever seen was 1.108 million barrels per day from the first week of December 2017, but all through 2019 it remained reliably strong, ranging from 943,000 barrels per day to 1.096 million barrels per day. Total U.S. ethanol production last year was 15.8 billion gallons, 14.6 billion of which was consumed domestically and 1.2 billion of which was exported.
Then came the "lockdown recession," which meant fewer people driving -- some without income to buy fuel and some who just no longer had any events to attend, stores to visit or restaurant meals to eat. Everyone in the industry knew the downward slide in ethanol demand wouldn't go on forever to zero. Essential workers still had to fill up their fuel tanks with ethanol-blended fuel to get to work. Everybody else still had to go to the grocery store every once in a while. Eventually, some of the initial panic would subside, the ICUs would ramp up capacity, and there would be some kind of recovery in the nation's (and the world's) economic activity. But the question remained (and still remains): how quickly would the economy recover back to "normal?"
There was even talk of a "V-shaped" recession -- one that bounced back as quickly as it fell apart. A data series that measured the economic activity of that V-shaped recession would, on a chart, look like the letter "V" -- symmetrically angling back in a straight line toward the top right corner of the chart. But what data series really measures the Economy? Not the stock market (which doesn't represent all businesses and is heavily influenced by interest rate policies) and not necessarily new home building permits or new business startups. Some economists used to look at satellite data of cars parked outside shopping malls to indicate how much economic activity was going on, but lately, while homebound shoppers have turned to online shopping, that's not a very reliable data series either.
Honestly, ethanol production data seems like as good of a proxy for overall economic activity as almost any other data series. If people are doing more things and driving around more with ethanol-blended fuel in their tanks, the market will respond to show that.
From this measure, we can now see the recovery hasn't been "V-shaped." There were eight weeks from the start of the panic to the low and there have now been another eight weeks of steady recovery off that low. However, the steady recovery has not occurred at the same pace as the original losses. Since April 24, weekly ethanol production figures have grown week by week, but at an average pace of only 6% each week. The latest datum, showing 893,000 barrels of ethanol produced per day in the United States, is an incomplete recovery of the "normal" state, still 13% below the average pace from 2019. Most predictions for ethanol demand, ethanol production or overall economic activity through the rest of 2020 suggest it might only ever get back to 90% of what it once was.
In other words, the "V" is lopsided, if it will ever be a "V" at all.
Elaine Kub is the author of "Mastering the Grain Markets: How Profits Are Really Made" and can be reached at masteringthegrainmarkets@gmail.com or on Twitter @elainekub.
(c) Copyright 2020 DTN, LLC. All rights reserved.