

2021 Digital Yield Tour Results
Digital Yield Tour Finds Strong National Yield Potential
â??Lindsay Greiner grows corn and soybeans in the rolling hills of southeast Iowa near Keota, where he typically battles drought. But, ample and timely rains this year have kept even his sandy soils from drying out and his crops a healthy green.
"The numbers sound realistic to me," Greiner says of the 199-bushel-per-acre Iowa corn yield estimate from the DTN/Progressive Farmer Digital Yield Tour, powered by Gro Intelligence. "Usually, things aren't as bad as you think they are or not as good as you think."
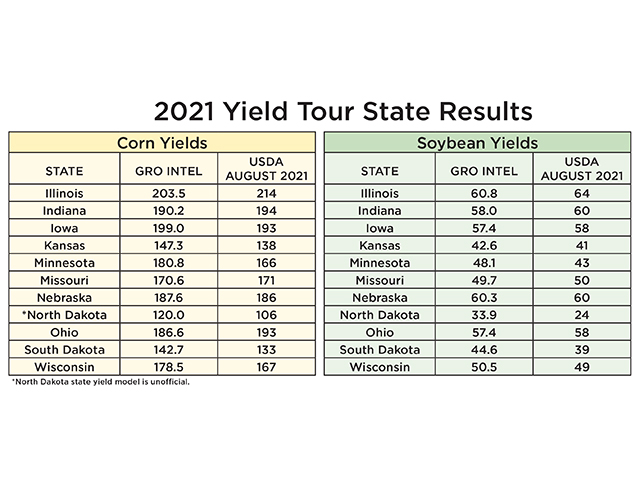
Iowa was one of 11 states examined in this year's tour, which provided an in-depth look at Gro's corn and soybean yield models during the week of August 9 through 13. Those states weigh heavily in Gro's national yield models, which predicted a national average corn yield of 176.5 bpa and soybean yield of 51.5 bpa. Both are higher than USDA's August estimates of 174.6 bpa and 50 bpa.
The estimates aren't too far apart, just about 2 bpa on corn and 1.5 on soybeans, but USDA and Gro arrived at the numbers in different ways.
Gro Senior Research Analyst Mintak Joo says Gro's yield models provided a more moderate view of the progress of corn and soybean crops. Where conditions have been ideal in the Eastern Corn Belt, Gro forecasts solid crops while USDA is predicting record-shattering numbers. Where drought has hampered production in the Dakotas, Minnesota and Wisconsin, USDA likewise is predicting lower and more dire yield situations than Gro.
For example, Gro sees a strong 203.5-bpa corn yield in Illinois, while USDA predicts 214 bpa, a number that would top the previous state yield record by 4 bpa. Where Gro predicts a North Dakota corn crop diminished to 120 bpa, on average, USDA sees the state plummeting to 106 bpa, the lowest in more than a decade.
"Overall, USDA's estimates are more extreme, which is why, when you average it out, we're relatively close on the overall yield estimates," Joo explains.
That difference is mostly driven by how USDA and Gro are operating in late summer, with USDA relying mostly on farmer surveys, and Gro watching algorithm-driven yield models adjusting to real-time weather and satellite data.
P[L1] D[0x0] M[300x250] OOP[F] ADUNIT[] T[]
"Basically, our models account for more chance of recovery for the corn and especially soybean crops in the latter part of the season than USDA is accounting for," Joo says. "That's survey versus modeling at play."
Time will tell, but there is plenty of reason to believe Gro's numbers may be more accurate at this point in the season, DTN Lead Analyst Todd Hultman says.
"I consider the national yield estimates from this year's Digital Tour of 176.5 bpa for corn and 51.5 bpa for soybeans to be good, credible estimates for this time of year," he explains. "For a risk manager, the tour estimates are probably even better benchmarks at this point than USDA's estimates, because they have a little more bearish possibility built in for this fall."
August estimates are, in general, a thorny undertaking, Hultman cautions.
"It is still quite early in the growing season, and weather remains a key variable," he says. "Even USDA, with all its resources and access to 18,600 producer surveys, has a 90% confidence interval of plus or minus 6.7% over the past 20 years for corn, the equivalent of give or take a billion bushels."
What the Digital Yield Tour did show was just how important weather, especially local conditions, plays in this year's yield picture, DTN Ag Meteorologist John Baranick says.
"There has been drought in the northwestern Corn Belt all season long stretching back to last year," he says. "And, in the Southeast, there either was none, or it was alleviated rather nicely by rains early in the season. And, then there is the transition zone between the two that has seen much lower rainfall overall and going in and out of drought throughout the season as storms hit and missed."
Keith Peters farms in one of those "missed" pockets in Ohio's Pickaway County.
"I know farmers a little south and west of me, and they have some of the best crops they've ever had," Peters says, adding that Gro's estimate of 186.6 bpa is pretty close. "It's hard to hear how great the crop (statewide) is going to be."
Gro's models will continue to update daily.
You can find links to those, as well as videos and our state-by-state reporting, by visiting
https://spotlights.dtnpf.com/….
-- Emily Unglesbee and Matt Wilde contributed to this story.
**
For More Information:
-- Review the tour's findings on www.dtnpf.com and on Twitter using the hashtag #dtnyieldtour21
-- Digital Yield Tour: https://spotlights.dtnpf.com/…
-- Follow Katie on Twitter @KatieD_DTN
[PF_0921]
(c) Copyright 2021 DTN, LLC. All rights reserved.