USDA Feb. 1 Cattle on Feed Report
Feb. 1 Cattle on Feed Down 4%
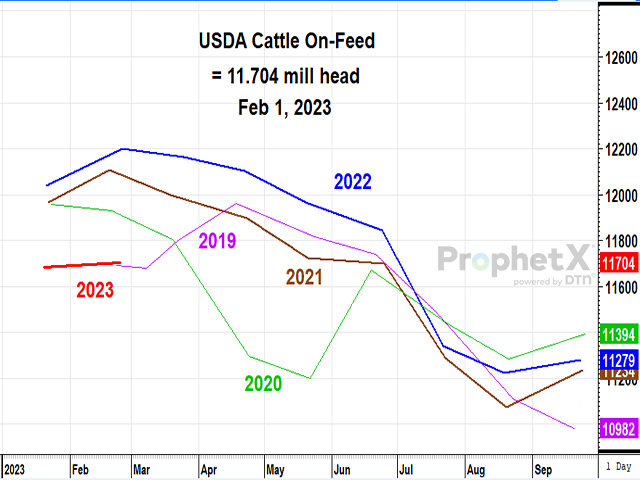
OMAHA (DTN) -- Cattle and calves on feed for the slaughter market in the United States for feedlots with capacity of 1,000 or more head totaled 11.7 million head on Feb. 1, 2023. The inventory was 4% below Feb. 1, 2022, USDA NASS reported on Friday.
Placements in feedlots during January totaled 1.93 million head, 4% below 2022. Net placements were 1.87 million head. During January, placements of cattle and calves weighing less than 600 pounds were 405,000 head, 600-699 pounds were 420,000 head, 700-799 pounds were 540,000 head, 800-899 pounds were 402,000 head, 900-999 pounds were 100,000 head, and 1,000 pounds and greater were 65,000 head.
Marketings of fed cattle during January totaled 1.85 million head, 4% above 2022.
P[L1] D[0x0] M[300x250] OOP[F] ADUNIT[] T[]
Other disappearance totaled 63,000 head during January, 2% below 2022.
DTN ANALYSIS
"Friday's Feb. 1 Cattle on Feed report is everything we expected it to be -- bullish, bullish, bullish," said DTN Livestock Analyst ShayLe Stewart. "Regardless of where you choose to spend your time analyzing the report (whether it be the on-feed data, the placement data, the number of cattle marketed, or the report as a whole), one cannot deny how the change in our beef cowherd is affecting this year's market. Seeing bullish reports like this will likely be the theme of the COF reports well through the 2023 calendar year.
"It's logical and easy to understand that we sit with fewer cattle on feed than compared to a year ago, as the nation simply possesses fewer cattle than what it did a year ago and given how strong the fat cattle market is, which is pulling cattle ahead of schedule and out of feedlots sooner than expected. Normally, when looking at COF data, we compare the most recent data to that of a year ago, but given that we all can understand the changes in our market compared to what it was a year ago, I think it's more worth our time to dissect how on-feed and placements are changing month over month.
"On Jan. 1, 2023, there were 11,682,000 head of cattle on feed. On Feb. 1, 2023, there were 11,704,000 head on feed -- a month-over-month increase of 22,000 head, which largely stemmed from Kansas.
"During the month of December 2022, there were 1,784,000 head of feeders placed. During January 2023, there were 1,932,000 head of feeders placed -- which is 4% less than what was placed during January 2022. Seeing more cattle placed in January than in December is logical, as the market only really trades feeder cattle for the first two weeks of December before breaking for Christmas. There were also many producers who opted to hold onto their calves through the end of the year, hoping to find a stronger market in January.
"And during the month of December 2022, there were 1,741,000 head of cattle marketed. Through January 2023, there were 1,847,000 head of cattle marketed -- an increase of 4% compared to a year ago. Incredible beef demand and sharply lower carcass weights have pressured packers into needing to support the cash cattle market more than they'd like to.
"In conclusion, it's extremely encouraging to see the results of Friday's Cattle on Feed report. I know that the report largely focuses on changes year over year, but given the dynamic nature of this market and how quickly things can change, I find great merit in studying the changes month over month to see what trends are developing and how the market is evolving. The market's fundamentals are strong, and prices will likely continue to represent just that."
**
DTN subscribers can view the full Cattle on Feed reports in the Livestock Archives folder under the Markets menu. The report is also available at https://www.nass.usda.gov/….
| USDA Actual | Average Estimate | Range | |
| On Feed Feb. 1 | 96% | 96.3% | 95.7-99.5% |
| Placed in January | 96% | 97.1% | 95.5-99.7% |
| Marketed in January | 104% | 104.0% | 102.7-104.6% |
(c) Copyright 2023 DTN, LLC. All rights reserved.


