USDA Jan. 1 Cattle Inventory Report
Jan. 1 Cattle Inventory Down 3%
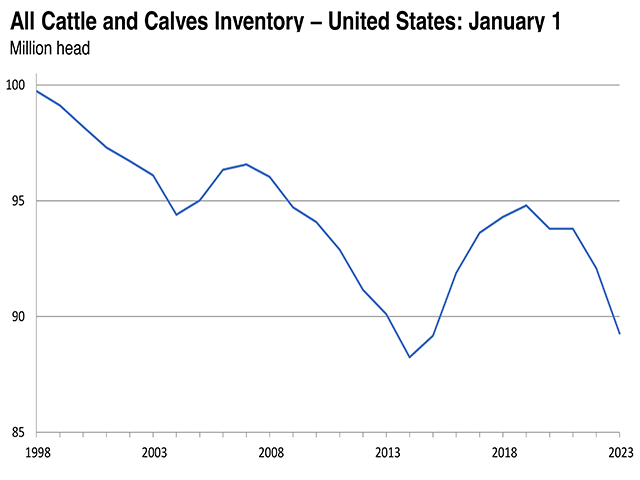
OMAHA (DTN) -- All cattle and calves in the United States as of Jan. 1, 2023, totaled 89.3 million head, 3% below the 92.1 million head on Jan. 1, 2022, USDA NASS reported on Tuesday, Jan. 31.
All cows and heifers that have calved, at 38.3 million head, were 3% below the 39.4 million head on Jan. 1, 2022. Beef cows, at 28.9 million head, were down 4% from a year ago. Milk cows, at 9.40 million head, were up slightly from the previous year.
All heifers 500 pounds and over as of Jan. 1, 2023, totaled 19.2 million head, 4% below the 19.9 million head on Jan. 1, 2022. Beef replacement heifers, at 5.16 million head, were down 6% from a year ago. Milk replacement heifers, at 4.34 million head, were down 2% from the previous year. Other heifers, at 9.67 million head, were 3% below a year earlier.
Steers weighing 500 pounds and over as of Jan. 1, 2023, totaled 16.1 million head, down 3% from Jan. 1, 2022.
Bulls weighing 500 pounds and over as of Jan. 1, 2023, totaled 2.03 million head, down 4% from Jan. 1, 2022.
Calves under 500 pounds as of Jan. 1, 2023, totaled 13.6 million head, down 3% from Jan. 1, 2022.
P[L1] D[0x0] M[300x250] OOP[F] ADUNIT[] T[]
Cattle and calves on feed for the slaughter market in the United States for all feedlots totaled 14.2 million head on Jan. 1, 2023. The inventory is down 4% from the Jan. 1, 2022, total of 14.7 million head. Cattle on feed in feedlots with capacity of 1,000 or more head accounted for 82.5% of the total cattle on feed on Jan. 1, 2023, up 1% from the previous year. The combined total of calves under 500 pounds and other heifers and steers over 500 pounds (outside of feedlots) at 25.3 million head, was 3% below Jan. 1, 2022.
CALF CROP DOWN 2%
The 2022 calf crop in the United States was estimated at 34.5 million head, down 2% from the previous year's calf crop. Calves born during the first half of 2022 were estimated at 25.3 million head, down 2% from the first half of 2021. Calves born during the second half of 2022 were estimated at 9.16 million head, 27% of the total 2022 calf crop.
REVISIONS
All inventory and calf crop estimates for July 1, 2021, Jan. 1, 2022, and July 1, 2022, were reviewed using calf crop, official slaughter, import and export data, and the relationship of new survey information to the prior surveys. Based on the findings of this review, Jan. 1, 2022, all cattle and calves increased by 0.2% and 2021 calf crop increased by 0.2%.
July 1, 2022, all cattle and calves decreased by 0.2% and 2022 calf crop decreased by 0.4%.
State-level estimates were reviewed and changes were made to reallocate inventory estimates to the United States total.
DTN ANALYSIS
"Tuesday's Jan. 1 Cattle inventory report revealed a reality the cattle market has never seen before -- a beef cow herd of 28.9 million head," said DTN Livestock Analyst ShayLe Stewart. "Cattlemen knew that there were going to be significantly fewer beef cows reported in Tuesday's report than compared to a year ago, as a lack of profitability and severe drought conditions pressured ranchers to cull their cow herds dramatically. But what Tuesday's report solidifies is that not only do we have 'fewer' beef cows in the industry than compared to years past, but also that we have the fewest beef cows ever recorded. That's a stark reality to stomach and a factor that should send the cattle market soaring.
"The top 10 states with the most beef cows are Texas, Oklahoma, Missouri, Nebraska, South Dakota, Kansas, Montana, Kentucky, North Dakota and Florida. Only one of those states (Missouri) had the same number of beef cows as compared to a year ago, and the other states saw decreases in their beef cow herds anywhere from 1% to 7%.
"The Cattle Inventory Report also disclosed a smaller calf crop than compared to a year ago, which is logical when there are simply fewer cows in the market.
"In conclusion, Tuesday's report comes as an extremely bullish factor to the cattle market and the beef industry. Tight supplies amid strong demand beckon for prices to become stronger, and stronger prices will likely be the theme of the market over the next two to potentially three years until the market sees substantial build back."
**
DTN subscribers can view the full USDA Cattle inventory report in the Livestock Archives folder under the Markets menu. The report is also available at https://www.nass.usda.gov/….
| Class | 2022 | 2023 | % of previous year |
| (1,000 head) | (1,000 head) | (percent) | |
| All cattle and calves | 92,076.6 | 89,274.1 | 97 |
| All cows and heifers | |||
| that have calved | 39,360.1 | 38,320.4 | 97 |
| -- Beef cows | 29,983.1 | 28,917.9 | 96 |
| -- Milk cows | 9,377.0 | 9,402.5 | 100 |
| All heifers 500 lbs. and over | 19,916.0 | 19,172.5 | 96 |
| -- For beef cow replacement | 5,481.5 | 5,163.7 | 94 |
| Expected to calve* | 3,339.5 | 3,168.7 | 95 |
| -- For milk cow replacement | 4,440.6 | 4,337.2 | 98 |
| Expected to calve* | 2,826.2 | 2,769.4 | 98 |
| -- Other heifers | 9,993.9 | 9,671.6 | 97 |
| Steers 500 pounds and over | 16,704.7 | 16,131.6 | 97 |
| Bulls 500 pounds and over | 2,109.6 | 2,029.0 | 96 |
| Calves under 500 pounds | 13,986.2 | 13,620.6 | 97 |
| All cattle on feed | 14,694.6 | 14,157.3 | 96 |
| 2021 | 2022 | % of previous year | |
| Calf crop | 35,165.9 | 34,464.5 | 98 |
(c) Copyright 2023 DTN, LLC. All rights reserved.


