

USDA Dec. 1 Cattle on Feed Report
Dec. 1 Cattle on Feed Down 3%
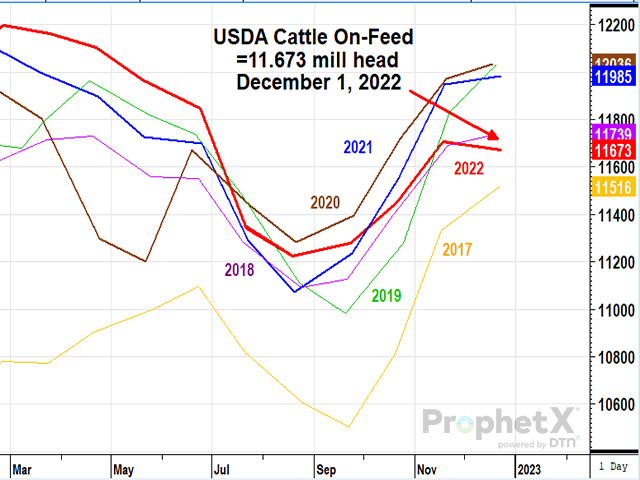
OMAHA (DTN) -- Cattle and calves on feed for the slaughter market in the United States for feedlots with capacity of 1,000 or more head totaled 11.7 million head on Dec. 1, 2022. The inventory was 3% below December 1, 2021, USDA NASS reported on Friday.
Placements in feedlots during November totaled 1.93 million head, 2% below 2021. Net placements were 1.87 million head. During November, placements of cattle and calves weighing less than 600 pounds were 540,000 head, 600-699 pounds were 465,000 head, 700-799 pounds were 405,000 head, 800-899 pounds were 290,000 head, 900-999 pounds were 135,000 head, and 1,000 pounds and greater were 90,000 head.
Marketings of fed cattle during November totaled 1.89 million head, 1% above 2021. Marketings were the highest for November since the series began in 1996.
P[L1] D[0x0] M[300x250] OOP[F] ADUNIT[] T[]
Other disappearance totaled 57,000 head during November, 7% below 2021.
DTN ANALYSIS
"Friday's Cattle on Feed report unveiled exactly what was expected: fewer cattle on feed, lighter placements and stronger marketings. But the report does need some further explanation from there," said DTN Livestock Analyst ShayLe Stewart.
"First, it's supportive to the market that on-feed numbers are lighter. To be exact, as of Dec. 1, there were 11,673,000 head of cattle on feed, which is 3% less than a year ago. The states with the largest inventory of cattle on feed are Texas with 2,810,000 head (which is 2% less than a year ago), Nebraska with 2,610,000 head (which is up 1% from a year ago), Kansas with 2,330,000 head (which is 6% less than a year ago) and Colorado with 1,040,000 head (which is 9% less than a year ago).
"Second, the placement data is supportive to the market in the sense that it's lower than a year ago, but it wasn't by as drastic an amount as some analysts thought. Before the report, analysts believed placements in November would range anywhere from 91.8% to 98.0% of a year ago, with an average guess of around 95.7%. Friday's report unveiled that placements totaled 1,925,000 head, which is 2% less than a year ago. Given that the pre-report consensus believed that placements would be fewer than what it was, the placement data is still supportive, but it's not as bullish in its nature as originally thought. What traders will do with the placement data of this report remains the wild card. If they opt to find it still supportive, then the feeder cattle market should have no problem trading higher. If they find it to be lukewarm in its support, feeders could still trade higher given that on-feed numbers are lower and that marketings were more aggressive than originally assumed. And let's not forget, with the weather conditions that the nation has faced throughout December, next month's report will likely show a bigger dip in placements.
"And, lastly, the marketing data of Friday's COF report was extremely supportive as, through the month of November, there were 1,891,000 head marketed -- which is the largest November marketing that the COF report has seen since it began in 1996. The market's most recent matter of concern has been whether or not current throughput speeds will be aggressive enough to allow feedlots to maintain currentness. And with seeing Friday's marketing data, I'm relieved to know that at least through December and well through January, showlists stand a fair shot at staying current given that they were so aggressively cleaned up earlier in the year.
"In conclusion, I find Friday's Cattle on Feed report to be supportive to the cattle market. The combination of fewer cattle on feed, slightly lighter placements and the most aggressive marketings that any November has seen since 1996 is no small feat."
**
DTN subscribers can view the full Cattle on Feed reports in the Livestock Archives folder under the Markets menu. The report is also available at https://www.nass.usda.gov/….
| USDA Actual | Average Estimate | Range | |
| On Feed Dec. 1 | 97% | 97.1% | 96.5-97.6% |
| Placed in November | 98% | 95.7% | 91.8-98.0% |
| Marketed in November | 101% | 100.9% | 99.9-101.3% |
(c) Copyright 2022 DTN, LLC. All rights reserved.

