USDA Cattle on Feed Report
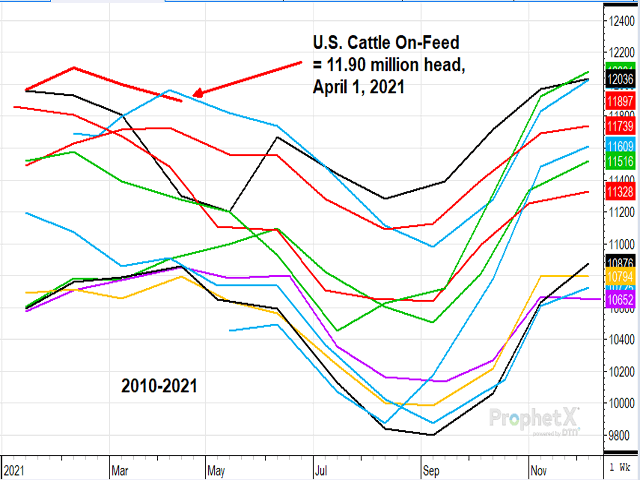
April 1 Cattle on Feed Up 5%
OMAHA (DTN) -- Cattle and calves on feed for the slaughter market in the United States for feedlots with capacity of 1,000 or more head totaled 11.9 million head on April 1, 2021. The inventory was 5% above April 1, 2020. This is the second-highest April 1 inventory since the series began in 1996, USDA NASS reported on Friday.
The inventory included 7.41 million steers and steer calves, up 5% from the previous year. This group accounted for 62% of the total inventory. Heifers and heifer calves accounted for 4.49 million head, up 7% from 2020.
Placements in feedlots during March totaled 2.00 million head, 28% above 2020. Net placements were 1.94 million head. During March, placements of cattle and calves weighing less than 600 pounds were 405,000 head, 600-699 pounds were 325,000 head, 700-799 pounds were 510,000 head, 800-899 pounds were 522,000 head, 900-999 pounds were 175,000 head, and 1,000 pounds and greater were 60,000 head.
P[L1] D[0x0] M[300x250] OOP[F] ADUNIT[] T[]
Marketings of fed cattle during March totaled 2.04 million head, 1% above 2020. Marketings were the second highest for March since the series began in 1996.
Other disappearance totaled 60,000 head during March, 2% below 2020.
DTN ANALYSIS
"Numbers can be both useful tools or aggravating mysteries, and their blessing or burdensome nature usually falls in the context in which they are understood," said DTN Livestock Analyst ShayLe Stewart. "If you just look at Friday's Cattle on Feed numbers with a year-over-year perspective, the cattle market looks outrageously ugly. But when you compare the 2021 figures to those of 2019, or the standing three- and five-year averages, Friday's Cattle on Feed report isn't so bewildering.
"The COF report is a year-to-year comparison of the number of cattle on feed, placed and marketed during one month. It would be silly to waste our time comparing 2021 figures to those of 2020, as COVID-19 distorted the marketplace. So, let's compare the 2021 data shared Friday afternoon with that of 2019.
"Compared to March of 2019, Friday's data shows a neutral-to-bullish report. Friday's on-feed numbers are 99% of that in March 2019, the number of cattle placed are 99% of that in March 2019 and the number of cattle marketed in March 2021 was 115% more than in March of 2019.
"As per Friday's data, we fully understood that there would be an increase in placements from the March 2021 COF report (1,684,000 head) to the April 2021 COF (1,997,000) report, as the snowstorm in February gravely affected the cattle market's ability to buy, sell and transport cattle properly. But potentially even more noteworthy has been the market's ability to market and sell beef as consumer demand is truly exceptional. Moving forward, the market will have more cattle that will be in need of being processed, but with slaughter speeds as aggressive as they've been, Friday's total on-feed number doesn't come as a monstrous burden given the market's recent demand.
"Friday's COF report is packed with useful information, but it's vital that we compare the data cumulated in 2021 to those of 2019 and beyond. Friday's COF report shouldn't come as a great disturbance to the market," Stewart said.
| APRIL 2021 COF REPORT | |||
| 2021/2019 Change | |||
| On Feed | 0.99 | ||
| Placed | 0.99 | ||
| Marketed | 1.15 | ||
| April 3-YR AVG ('19,'18,'17) | 2021 | % change | |
| On Feed | 11,532,333 | 11,897,000 | 1.03 |
| Placed | 2,012,333 | 1,997,000 | 0.99 |
| Marketed | 1,843,667 | 2,040,000 | 1.11 |
| April 5-YR AVG (excluding 2020) | 2021 | % change | |
| On Feed | 11,249,400 | 11,897,000 | 1.06 |
| Placed | 1,947,600 | 1,997,000 | 1.03 |
| Marketed | 1,781,800 | 2,040,000 | 1.14 |
**
DTN subscribers can view the full Cattle on Feed reports in the Livestock Archives folder under the Markets menu. The report is also available at https://www.nass.usda.gov/….
| USDA Actual | Average Estimate | Range | |
| On Feed April 1 | 105% | 106.2% | 105.3%-107.5% |
| Placed in March | 128% | 134.3% | 128.0%-143.4% |
| Marketed in March | 101% | 101.1% | 100.5%-101.6% |
(c) Copyright 2021 DTN, LLC. All rights reserved.


