
DTN Fertilizer Outlook
Wholesale Ammonia Prices Climb in August, May Signal Higher Nitrogen Prices on the Way
The following is a recap of fertilizer price trends and market developments for the month of August.
AMMONIA
Domestic: Ammonia saw a month of firming sentiment in the U.S. market, following gains in global ammonia pricing during a period of slow demand typical for late summer.
On a basis of price per short ton (t) FOB (free-on-board, or sales price per ton of product without transportation costs included), U.S. ammonia prices rose nearly $200/t during the month, following lower price levels during earlier fourth-quarter prepay sales. August prices ended approaching the $600/t FOB mark in the Corn Belt, higher from early August price indications of around $400/t FOB.
U.S. sellers were also steadily raising offers ahead of the end of summer at ammonia production sites, with asking levels reaching $475-$500/t ex-works (EXW: a shipping arrangement in which a seller makes a product available at a specific location, but the buyer has to pay the transport costs) at Oklahoma area plants, up from $300/t EXW just after summer fill.
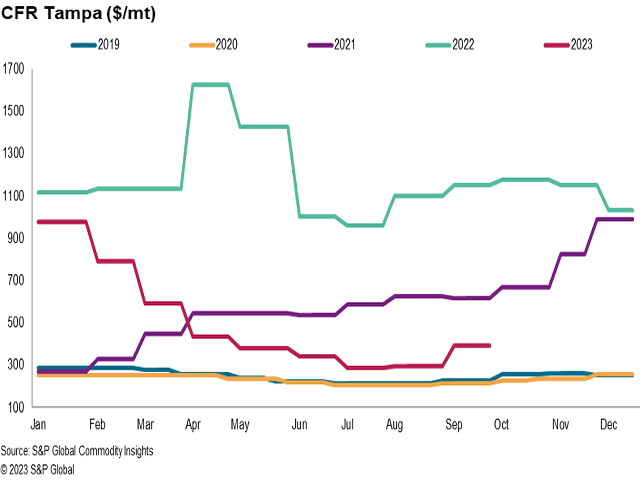
Several U.S. nitrogen plant turnarounds were also motivating the price increases, as buyers looking for prompt tons had fewer options available, mirroring fundamentals observed in the global ammonia market. Both the U.S. and global markets appear set to see rising prices for the foreseeable future, supported by another expected increase in the Tampa ammonia contract for October.
International: Yara and Mosaic, at the end of August, agreed on a price for September ammonia deliveries at Tampa of $390 per metric ton (mt) CFR (cost-and-freight, or sales price per ton of product with freight costs included). It was up $95/mt on the $295/mt CFR the parties previously agreed for August and came in the wake of a reduction in ammonia output in Trinidad & Tobago caused by a major natural gas supply curtailment.
The wider global ammonia market saw similar price increases in August, as elevated natural gas costs in Europe continued to incentivize more import buying to the region rather than increasing domestic production. The extended outage of Ma'aden's ammonia production facilities in Saudi Arabia, with a nameplate capacity well over 1 million metric tons (mmt) per year, provided additional support for higher prices.
Black Sea ammonia prices were nominally assessed from $315-$320/mt FOB at the end of last month, up from end-of-July levels of $270-$275/mt FOB alongside increases in the rest of the world. Caribbean FOB prices increased by nearly $100/mt to $340-$350, up compared to $245-$255/mt FOB at the end of July.
August ended with strong support for ammonia prices across the globe on account of the fewer tons available for export from major suppliers.
UREA
Domestic: Urea prices were somewhat stable in the second half of August as the high-summer lull in U.S. fertilizer market activity spanned the month. Earlier in the month, an India purchase tender brought some volatility, but the result of the announcement ended up bringing a softer tone to the market.
New Orleans, Louisiana, (NOLA) urea barges at the end of August were assessed at $340-$376/t FOB, trading higher from $375-$445/t FOB in the week ended Aug. 3. Prompt shipping barges continued to catch the higher end of our range, while September volumes traded toward the lower end. There were relatively few catalysts for trading during the month aside from the previously mentioned moves in the global market.
P[L1] D[0x0] M[300x250] OOP[F] ADUNIT[] T[]
Offers at Mississippi River terminal hubs reached $450-$475/t FOB at the end of the month, rising higher alongside NOLA barge values to a range of $440-$475/t FOB in July.
U.S. urea imports looked on track to match July and August 2022 levels at the end of the month, and with a relatively even trade balance expected to continue, urea prices were expected to continue following trends in the global market.
International: Global urea markets were under pressure in August as sellers were hard-pressed to find much demand. Chinese prices remained stable, given less pressure to sell following the Aug. 9 India purchase tender. China prices also remained at a discount to sales prices from Indonesia, while North African sellers maintained their quiet hold on prices as the bid-to-ask spread remained wide.
Egyptian urea prices still ended lower in August at $380-$400/mt FOB compared to the range of $422-$440/mt FOB assessed at the end of July, partly on account of the lack of activity over last month following the India tender in the first half of August.
Brazil urea prices, meanwhile, closed August at $345-$350/mt CFR, down from $410-$420 in the previous month as a lull in farmer demand and building stocks in the country put pressure on prices.
Higher freights continued to push delivered prices higher for suppliers, cutting away at netbacks. Sellers will need to find new markets where none are coming to the fold. Demand was expected to remain weak before a surprise India tender was announced in September. The results are expected to set the stage for price movement until the end of the third quarter.
UREA AMMONIUM NITRATE (UAN)
The U.S. nitrates market continued to drift last month, with most participants checked out of the market. The next expected period of demand will emerge alongside the fall harvest.
NOLA UAN barge prices ended August assessed at $220-$230/t FOB, up slightly from $220-$225/t FOB in July. Price levels remained largely stable on an overall lack of activity.
Major terminals along the Mississippi River saw prices end last month at similar levels to NOLA at $255-$260/t FOB, in line with offers from July and in line with the limited price movement observed at the U.S. Gulf.
The Fertecon U.S. East Coast import assessment also climbed higher with price increases from North American sellers to $260-$270/mt CFR, up from $180-$200 in July.
The pace of U.S. UAN exports slowed down year-over-year in July, according to the latest U.S. customs data. But for 2023 so far, the country has exported nearly 1 mmt of product -- more than twice the volume shipped for the same period last year. Exports will help keep accumulated inventories limited, and 2023 may finish without excess supply weighing on prices as a result.
PHOSPHATES
Domestic: Hurricane Idalia made landfall in the U.S. as a Category 3 storm at the end of August, bringing operations at Florida production plants, including Mosaic's phosphate facilities, to a halt. For this storm, at least, NOLA was left out of the path of destruction. However, last month was nonetheless firm for phosphate prices.
For example, NOLA DAP was assessed at $515-$525/t FOB at the end of August, higher than the $470-$500/t FOB range earlier in the month. MAP traded hands at $630/t FOB NOLA at the end of the month for first-half September shipping barges, compared to the $525-$560/t FOB NOLA in July.
Mississippi River terminal MAP prices edged similarly higher last month to $675-$695/t FOB, higher from offers at $650-$660/st FOB earlier in the month and trending higher alongside barges. DAP prices also increased to $580-$590/t FOB toward the end of August compared to the $550-$570/t FOB range at the start of the month.
After Hurricane Idalia passed, Mosaic confirmed in an Aug. 31 tweet that its facilities had escaped the storm and avoided major damage, despite some localized flooding. In Louisiana, an unexpected power interruption at the end of August resulted in damage to the largest sulfuric acid plant at Mosaic's Uncle Sam facility. Repairs are expected to be completed by the end of October.
International: Prices in the phosphate market came under pressure in late August, despite unscheduled production outages in the U.S. and China owing to Hurricane Idalia and an accident at a rock phosphate mine in Hubei, respectively.
India was able to secure DAP from Russia at $550/mt CFR during the last week of the month, about $100/mt higher from our assessment high end at the end of July.
Going west, the phosphate market was relatively uneventful during the last week of August, with mixed signals on the direction of pricing emerging. MAP pricing in Brazil still rose to $530/mt CFR by the end of the month, holding values $40/mt higher from July.
Prices in the global phosphates market appeared to be peaking at the end of August with a softer tone expected to emerge.
POTASH
Overall, the potash market slowed down in August following the conclusion of summer-fill sales programs. Although there was still some buying later in the month, prices were mostly stable with some asking price increases last month on domestic-origin product.
NOLA granular potash barge prices were assessed in a range of $325-$335/t FOB, up from the prior report assessment of $310-$334/t FOB in late July. Offers rose for the September and October shipping periods despite little activity in the prompt market following the post-summer-fill price reset.
River terminal potash offers were last reported in a range of $380-$410/st FOB, with no significant changes to price levels heard across August.
Fires in British Columbia, Canada, last month caused some delays in fertilizer rail shipments, including sulfur and potash railcars. Shipments from Russia and Israel have helped compensate, however, and U.S. potash imports are tracking closely with volumes brought in the same year-to-date period in 2022.
Nutrien last month announced it was indefinitely delaying its planned Canada potash production expansion to 18 million tons per year. North American potash producers have also reported lower-than-expected market price levels for 2023 so far and curbed expectations accordingly in the last round of quarterly financials.
**
Editor's Note: This information was supplied courtesy of Fertecon, S&P Global Commodity Insights.
(c) Copyright 2023 DTN, LLC. All rights reserved.

