DTN Retail Fertilizer Trends
Five of Eight Fertilizer Prices Lower, 10-34-0 Continues to Lead Downward Moves
LINCOLN, Neb. (DTN) -- The starter fertilizer 10-34-0 led the average price drop on five of eight fertilizers tracked by DTN in the third week of October, continuing to show a significant drop for the third consecutive week.
The average price of 10-34-0 came in 12% lower compared to one month ago at $759 per ton. DTN defines a significant drop in price as 5% or higher.
Two fertilizers recorded price drops of 2% including MAP and DAP. The average price of DAP came in at $930/ton while MAP was $986. The average price of potash fell by 1% to $863/ton. The price of UAN28 dropped fractionally to $576/ton.
P[L1] D[0x0] M[300x250] OOP[F] ADUNIT[] T[]
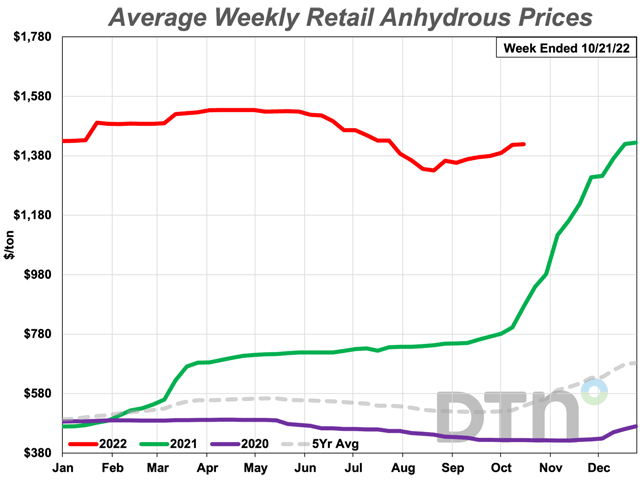
Three fertilizers tracked by DTN showed increases in average prices. Anhydrous recorded a 3% increase to $1,419/ton, urea a 2% hike to $826/ton, and UAN32 was up 1% to $678/ton.
The Leader-Telegram in Eau Claire, Wisconsin, reported Monday that construction is underway on a $20 million fertilizer plant near Stanley.
Loyal-based Northside Elevator bought 74 acres west of Stanley to build a plant that will be able to store about 14,000 tons of fertilizer. In addition, the company reportedly is building a 40,000-square-foot warehouse and 1,500-square-foot office space. The project also includes the construction of a tower system fertilizer manufacturing plant.
Despite lower prices in recent months, all fertilizers continue to be considerably higher in price than one year earlier.
MAP is 14% higher; DAP is 15% higher, urea is 12% higher and 10-34-0 is 15% higher; potash is 21% higher; UAN28 is 28% more expensive; UAN32 is 38% higher and anhydrous is 51% more expensive compared to last year.
DTN gathers fertilizer price bids from agriculture retailers each week to compile the DTN Fertilizer Index. DTN first began reporting data in November 2008.
| Dry | ||||
| Date Range | DAP | MAP | POTASH | UREA |
Oct 18-22 2021 | 810 | 863 | 716 | 735 |
| Nov 15-19 2021 | 825 | 911 | 769 | 859 |
| Dec 13-17 2021 | 858 | 935 | 796 | 901 |
| Jan 10-14 2022 | 863 | 932 | 807 | 913 |
| Feb 7-11 2022 | 876 | 935 | 815 | 905 |
| Mar 7-11 2022 | 919 | 955 | 822 | 901 |
| Apr 4-8 2022 | 1040 | 1056 | 875 | 1031 |
| May 2-6 2022 | 1057 | 1081 | 881 | 1001 |
| May 30-Jun 3 2022 | 1056 | 1079 | 880 | 979 |
| Jun 27-Jul 1 2022 | 1039 | 1053 | 885 | 867 |
Jul 25-20 2022 | 1005 | 1041 | 887 | 836 |
| Aug 22-26 2022 | 972 | 1026 | 880 | 804 |
| Sep 19-23 2022 | 950 | 1005 | 875 | 811 |
| Oct 17-21 2022 | 930 | 986 | 863 | 826 |
| Liquid | ||||
| Date Range | 10-34-0 | ANHYD | UAN28 | UAN32 |
| Oct 18-22 2021 | 659 | 940 | 451 | 492 |
Nov 15-19 2021 | 739 | 1220 | 571 | 651 |
| Dec 13-17 2021 | 790 | 1420 | 579 | 663 |
| Jan 10-14 2022 | 796 | 1430 | 584 | 679 |
| Feb 7-11 2022 | 827 | 1487 | 600 | 699 |
| Mar 7-11 2022 | 866 | 1490 | 603 | 704 |
| Apr 4-8 2022 | 901 | 1534 | 629 | 729 |
May 2-6 2022 | 906 | 1534 | 631 | 730 |
| May 30-Jun 3 2022 | 905 | 1529 | 633 | 731 |
| Jun 27-Jul 1 2022 | 904 | 1466 | 611 | 702 |
| Jul 25-20 2022 | 894 | 1431 | 596 | 693 |
| Aug 22-26 2022 | 869 | 1331 | 575 | 676 |
| Sep 19-23 2022 | 860 | 1376 | 578 | 670 |
| Oct 17-21 2022 | 759 | 1419 | 576 | 678 |
Todd Neeley can be reached at todd.neeley@dtn.com
Follow him on Twitter @DTNeeley
(c) Copyright 2022 DTN, LLC. All rights reserved.


