
Find Out If Cover Crops Pay
Cover Crop Calculator: Determine Financial Value of Cover Crops
ANKENY, Iowa (DTN) -- Farmers considering planting cover crops before or after harvest can find out if the conservation practice pays by using the Cover Crop Net Return Economic Simulator developed by the Iowa Soybean Association (ISA). Two Iowa farmers who use the tool know how much they'll profit.
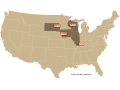
Wayne Fredericks pockets a little more than $39 and $17 per acre planting cover crops into corn and soybeans, respectively, according to the simulator. That's in north-central Iowa where many farmers don't think the conservation practice is economically viable or can work due to the climate and shorter growing season than farther south, said the Osage farmer.
About 75 miles to the south near Reinbeck, Iowa, Jack Boyer reported a similar net return from adding cover crops to his cropping system. Improved yields, organic matter, water usage, soil retention and more all, or in part, play a role in making cover crops pay, Boyer and Fredericks agreed.
Farmers can see if cover crops are profitable for themselves. Find the association's cover crop calculator at https://analytics.iasoybeans.com/….
Cover crops are one of the best ways to improve soil health and make farms more weather resilient. Economics, though, is one of the biggest stumbling blocks to adoption. Fredericks said the simulator can show the practice is good for the bottom line.
"Cover crops are probably one of the most difficult practices to take to the bank and tell them what my return is going to be," he asserted, noting that's no longer an obstacle. "It (the simulator) shows economically how (cover crops) can help in the long run."
Cover crop users say a yield reduction can occur during the first year or two of adoption as farmers fine tune management. But as grower knowledge and soil conditions improve, so does the probability of a return on investment.
If farmers and landowners give cover crops a chance and use the simulator, Boyer believes that may spark people to adopt the practice. Boyer and Fredericks, both longtime cover croppers, are part of an advisory panel that helped ISA researchers develop the calculator and continually refine it.
"I think it can be a valuable education tool," Boyer continued. "In my management style ... cover crops pay."
WEATHER RESILENCE
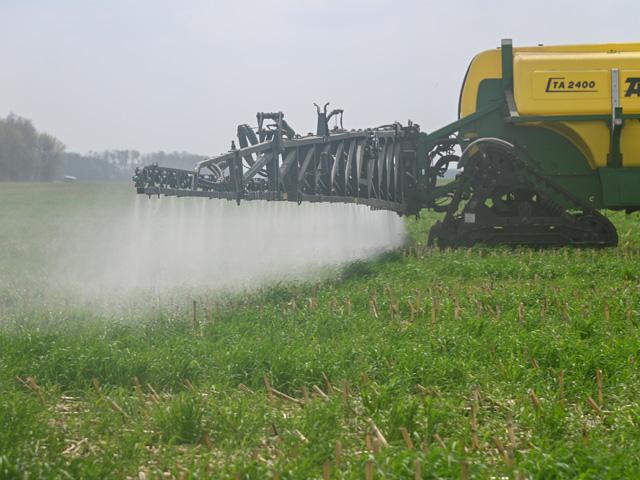
Planting cover crops such as cereal rye, annual rye, oats, hairy vetch and/or other plants just before or after harvest provides living, seasonal coverage of soil between commodity or forage crops. On-farm benefits include reduced soil erosion and compaction, improved water infiltration and storage, greater weed and pest suppression, better nutrient cycling, less sediment runoff and more.
P[L1] D[0x0] M[300x250] OOP[F] ADUNIT[] T[]
Boyer and Fredericks, who each plant cover crops on all their acres, say their crops are less stressed in dry years compared to neighboring fields without cover crops. Ponding after heavy rains and wind erosion isn't a worry on cover cropped acres, the farmers contend. "I believe it's because my soil is more resilient," Boyer concluded.
Yet, cover crops are only planted on 15.4 million acres or 3.9% of U.S. cropland, according to the 2017 U.S. Census of Agriculture.
The ISA created the simulator, which went live in late 2020, with the financial help of an Iowa Natural Resources Conservation Innovation Grant. The online tool fulfills multiple goals of the organization, said ISA Data Analyst Suzanne Fey.
By showing the financial potential of cover crops, that could boost adoption, Fey added. In turn, that can ensure the long-term sustainability and competitiveness of Iowa soybean farmers. However, farmers nationwide can use the free tool and benefit since individual data is used.
"What we're trying to do is help farmers find ways to make it (cover crops) work," Fey said.
SIMULATOR BASICS
The online interactive simulator shows visual illustrations of estimated economic outcomes of cover crops based on a range of market prices, potential yield changes and various income and cost offset opportunities. It also provides examples of cost offset opportunities and their impact on revenue, creating a sensitivity analysis of net return.
The simulator provides an easy starting point for those unfamiliar with cover crop management, as well as a useful platform for long-time cover crop beneficiaries. All formulas can be viewed, and input values edited and results automatically recalculated. Revenue sources have quick-select options to offset base costs, which can also be tweaked to reflect the specific programs available in your area.
The following are examples of data needed (data is cleared -- not saved -- when the application is closed):
1. Field and market information such as field size in acres (starting with a field size of 1 acre is recommended when drafting a simulation), cash crop after a cover crop, average cash crop yield and current market price of the chosen grain.
2. Cost to establish cover crop. Default, ballpark values are provided if needed.
3. Income opportunities such as grazing, harvesting forage or relay cropping cereal rye. If a user doesn't select an income opportunity, the default value remains at zero revenue for this category. Default values are included in each income option.
4. Cost mitigation opportunities such as state and federal assistance, carbon program payments, reduced commercial fertilizer needs, improved soil health/organic matter, reduced erosion and lower crop insurance premium, just to name a few.
5. Although not included in the individual field calculation, there is information related to added value for the greater good. This includes flooding mitigation and water quality improvements, among other things.
When using the simulator to figure the net return of planting corn after cover crops, Fredericks conservatively uses an average corn yield of 200 bushels per acre (bpa) (2021 yields averaged about 220 bpa) and a $5-per-bushel selling price. His estimated cost to buy and plant cereal rye is $26.71 per acre (includes a $10-per-acre reduction in herbicide costs). The mitigation value totals $65.76 per acre: reduced commercial fertilizer needs, $38.74 per acre; reduced insurance requirement, $10.50 per acre (cheaper countywide protection is chosen instead of more expensive revenue protection due to soil resilience); improved water retention, $5 per acre; reduced erosion, $1.52 per acre; and crop insurance discount, $10 per acre.
Fredericks said the calculator "puts a different look at cover crops than anyone is used to seeing. But the calculator is only as good as the data that goes in."
Building organic matter by 1% and reducing nitrogen needs by 40% are two of the big benefits of cover crops on Boyer's farm. "If you go buy a piece of property, you know that you're willing to give more money for one with higher organic matter. So, you know there's value there," he said.
Watch a video on how the Iowa Soybean Association Cover Crop Net Return Economic Simulator works: https://www.iasoybeans.com/….
Matthew Wilde can be reached at matt.wilde@dtn.com
Follow him on Twitter @progressivwilde
(c) Copyright 2022 DTN, LLC. All rights reserved.

