

DTN Fertilizer Outlook
US Wholesale Fertilizer Prices Seen Rising on Tight Supplies, Strong Demand
The following is a breakdown of wholesale prices and trends of the various fertilizers in January and first two weeks of February 2021.
AMMONIA
Domestic:
Following a trend in the second half of 2020, U.S. anhydrous ammonia prices continued to rise in January as supplies remain tight. Recovery for industrial ammonia consumption continues as chemical production adapts to COVID-19 challenges that contributed to restricting available volumes for agricultural use, as well plant outages and turnaround around the globe. OCI Beaumont, for example, will be down for scheduled maintenance for approximately two weeks from the last week of January.
A higher Tampa settlement for February reflects strong fundamentals on most nitrogen sources in the U.S. following urea's early year rally, steadily rising UAN values and incremental increases in agricultural ammonia prices. Illinois spring ammonia prices rose to $460 per short ton (t) by the end of January from earlier offers at $425-$430 after the higher Tampa announcement. Meanwhile, markets in the Eastern Corn Belt pulled offers from $415-$430/t and did not reoffer at higher values until the following week.
Plant prices ex-factory in Oklahoma before the higher Tampa settlement were at $275-$285/t prompt and $320-$325 for spring pull. while spring prices at Port Neal, Iowa, were reported at $415/t in mid-January. Prices at both plants reflect a $15-$25/t increase from initial prepay offers in December.
Many plants and markets had actually pulled their pricing at the same time, and some waited up to several days to reoffer, as a major jump in the urea and phosphate prices brought further chaos to the fertilizer market at the end of January.
In the short term, overall, we expect U.S. ammonia prices to stay firm given strong global fundamentals, including higher seasonal feedstock costs in natural gas and continued supportive demand.
International:
Yara and Mosaic agreed on a price for February of $330 per metric ton (mt) cost-and-freight (CFR) Tampa -- up $60 on the $270 CFR agreed at the end of December for January shipments and exceeding expectations of a price around $300 CFR. The settlement followed purchases for Nutrien, buying around 15,000 t Trinidadian ammonia from Koch, and a 40,000-ton purchase by Koch from Algeria, indicating demand in the U.S. for ammonia is exceeding available supply.
The Baltic ammonia contract price shot higher in January from $212-$214/mt FOB (free on board -- the buyer pays for transportation of the goods) in December to $228-$275/mt and was expected to settle higher yet for February as negotiations were still under way at the end of January. The Black Sea FOB price also rose roughly $50 from the previous month's achieved transactions to $268-$275/mt prior to the $60 increase at Tampa so increases are likely due in this region as well.
Nutrien announced late in the month that it halted production on its other large, approximately 650,000-mt-per-year plant in Trinidad for "an extended period" due to mechanical issues. With this and its September 2020 decision to indefinitely close its other large line at Point Lisas, Nutrien now has more than 50% of its ammonia production capacity in Trinidad down, a sign that ammonia prices will likely continue to rise on greater import needs from an increasingly tight global market.
In the short term, we see global ammonia prices as firm in both the Eastern and Western hemispheres, with supply tight and demand rising.
UREA
Domestic:
New Orleans, Louisiana, (NOLA) urea prices skyrocketed in January to $329-$365/t FOB as spring prepay demand kicked off early in 2021 as record U.S. farm incomes in 2020 motivated early purchases, well over $100/t higher than where trades ended in December. As soon as traders returned from the holidays, barges began trading hands and were quickly depleted given relatively weak demand to end 2020 and increased export sales in the same period, leaving domestic stocks lower.
P[L1] D[0x0] M[300x250] OOP[F] ADUNIT[] T[]
Mississippi River terminal urea tons along open sections followed in line with increases on NOLA barges to $355-$400/t FOB, up a whopping $75-$110/t from the end of December. Closed barging north of St. Louis on the upper river continued to support higher inland prices, given strong spring interest and few available tons not already committed. Indeed, barging conditions in spring 2021 will be as important as ever in fulfilling all the contracts we're seeing for April and May delivery.
On the factory side, offers rose to $400/t (ex-plant) in eastern Oklahoma and $380/t at Port Neal, $100-$120/t higher from December as prompt volumes quickly sold through for February and spring values rose quickly alongside other U.S. benchmark markets.
Last month's projections showed fertilizer year-to-date imports nearly 1.4 million tons behind the 2019-20 period from July through April. Cargoes from Algeria, Qatar and Russia were all booked for first-quarter to early second-quarter arrival, but tight supplies on the global scale, as well as an expected India tender early this year, all buoyed prices through the first month of the year.
In the short term, we expect U.S. urea values to stay stable to firm, even as early February saw NOLA barge values take a $40/t tumble given strong underlying domestic and global fundamentals.
International:
The direction of the international urea market undoubtedly trends upward as wait-and-see buying strategies became fruitless as the season approaches and volumes from large producers are in short supply. Rumors of an Indian purchase tender, which did not in the end materialize in January, also created further bullishness in the NOLA market.
Producers in Egypt and the AG are largely committed for first-quarter 2021 as Egyptian urea prices rose to $375-$380/mt FOB, $100 higher from the previous month. In Brazil, urea prices ended January up $120 at $385-$395/mt CFR as Brazil and NOLA continued to pick up daily in line with increasing FOB values at the end of the month.
With tight availability out of the Arab Gulf in the first quarter owing to prior commitments and lower production levels from nearby producers due to turnarounds, it remains to be seen whether India comes out in February with a tender or how much they could buy for Feb-March shipment.
Coming out of January, world urea prices appeared set to firm further in the short term.
UAN
January saw a month of firming U.S. UAN values at last, long expected after CF made efforts to hold prices stable at summer-fill prices from July until December.
NOLA UAN barges had largely sold out through February by the time 2021 rolled around, leaving market participants few offers for prompt barge volumes and price assessors with a difficult job in front of us. At the end of January, barges were assessed at $150-$160/t FOB, $20-$30 higher from December as prices rose across the country but with NOLA values lagging slightly behind river terminal prices as is typical for the season.
For its part, CF raised its main terminal offers from Cincinnati and Mt. Vernon as high as $227/t FOB in the last week of January, up from $160-$165/t FOB in December, which reflected values $15 above summer fill. In general, spring values from March to May continue to see the bulk of U.S. buyer interest over immediate delivery.
In potentially the largest increase in price, the East Coast import assessment rose $80/t on the low end to $225-$235/t CFR as availability in the region ran in even shorter supply as Russian producers had focused on the domestic season in late 2020.
At the factory level, Port Neal, Iowa, offers on UAN 32% ended January at $200/t FOB prompt pull and $20 higher for spring tons, up $25-$30 from December. Eastern Oklahoma prices were reported at $195-$200/t FOB prompt, $50 higher from December offers.
In the short term, UAN is expected to be supported by higher prices across the U.S. nitrogen complex, including a higher Tampa ammonia settlement and urea's January bull run, as its prices remain well below parity to urea in terms of cost per unit of nitrogen.
PHOSPHATES
Domestic:
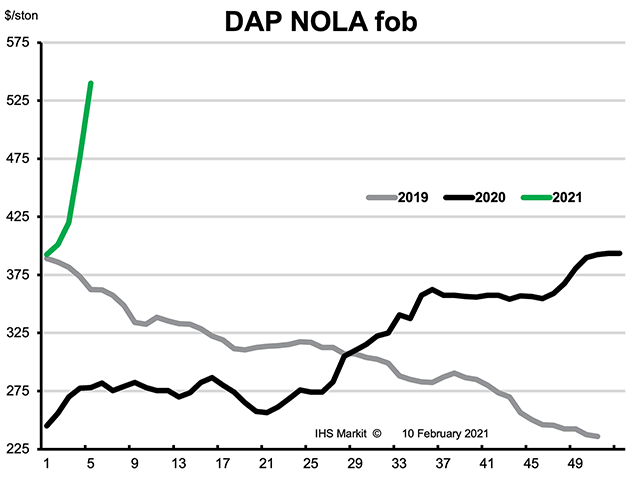
Phosphate prices in the U.S. continued to show extremely strong values in January as imports continued to trail behind demand and with MAP volumes having dried up considerably at the end of the month, which drove both DAP and TSP prices sharply higher.
In fact, the last time NOLA DAP traded $545/t or higher was in the fall of 2012, a month when CBOT corn futures were trading at over $7/bushel. In 30 years of price history of Fertecon's U.S. Fertilizer Report, there were only three periods in which the median weekly NOLA DAP trade range surpassed $500/t: 2007-08, 2010-11 and in 2012. NOLA MAP in January traded as high as $550/t FOB, up over $130/t from the end of December, while DAP rose over $150/t from last month's lows.
Some river terminal-level sales reported reduced demand with higher phosphate prices along open sections of the river reporting DAP at $555-$585/t FOB, $40-$85 higher from last month. MAP was reported in the same markets at well over $600/t if volumes were to be found at all.
Given a potentially bullish early February development that significantly lowered tariffs on Russian-based phosphates, we still expect U.S. phosphate prices to remain firm in the short term ahead of final determinations in the countervailing duty case. However, perhaps some potentially lower tariff rates could assuage some anxiety about late-spring phosphate availability and limit further rapid gains on NOLA phosphates.
International:
The phosphate market remains extremely strong, with most global producers having sold most of their volumes through February and beyond in some cases. Prices for MAP/DAP in the U.S., MAP in Brazil and DAP in Europe all move upward in January on tight availability.
DAP in India finished January with no market assessment, as demand dropped off ahead of India settling its 2021-22 fertilizer-year budget after rising $10 past December's price at $365/mt CFR. Meanwhile, the Brazilian MAP market looked cheap by comparison to the U.S. despite jumping $80-$85 last month to $490/mt CFR for February shipment.
Solid agricultural fundamentals exiting January and strong order books suggest the scene is set for prices to move higher still in the coming weeks. In the short term, we expect world phosphate prices to remain firm.
POTASH
NOLA potash barge prices rose steadily during a trading month dominated by N and P fertilizers, but still saw some liquidity at the U.S. Gulf, up $25/t month over month to $270-275/t FOB. As could maybe be expected considering the more controlled supply situation of potash in comparison to other fertilizers, the potash market seems to be feeling out 2021 in a more measured approach than its nitrogen and phosphate counterparts.
Granular potash prices in markets along open sections of the Mississippi River terminals rose to $300-$315/t FOB, a $5 increase over the previous week as values move higher toward mine replacement costs. With suppliers, retailers and others along the value chain still reeling from the heavy 2020 fall/winter application season, U.S. potash emerged from the holiday period with mostly stable values working higher toward replacement costs at $300/t ex-North American mines.
Negotiations for pivotal supply contracts for India caused some uproar, as an agreement was struck with Belarus at values other global producers called well under market conditions, in a move that signals the global market is still figuring out its path forward into 2021.
In the short term, however, potash saw some spillover support from the NPK fertilizer complex and firm crop values leaving our outlook for potash values stable to firm.
**
Editor's Note: This information was supplied courtesy of Fertecon, Agribusiness Intelligence, IHS Markit.
(c) Copyright 2021 DTN, LLC. All rights reserved.

