DTN Retail Fertilizer Trends
Majority of Fertilizer Prices Continue to Decline, Except for MAP, DAP
OMAHA (DTN) -- A two-month-old trend continued in the final week of October: A majority of retail fertilizer prices declined, according to retailers surveyed by DTN.
Six of the eight fertilizers tracked by DTN experienced slight declines, while one fertilizer recorded a 4% increase and another a 2% increase.
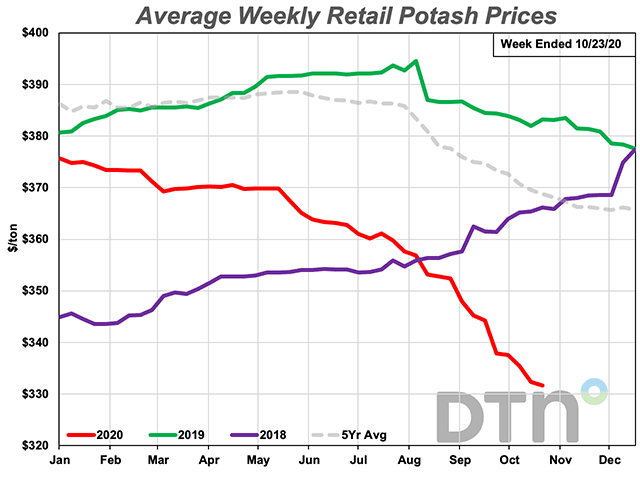
Potash had an average price $332 per ton, down $6; urea $358/ton, down $4; 10-34-0 $456/ton, down $1; anhydrous $424/ton, down $1; UAN28 $209/ton, down $3; and UAN32 $249/ton, down $1.
Of the two remaining fertilizers that had higher prices, MAP saw its average retail price increase by $18/ton, or about 4% from last month, to $477/ton.
The price of DAP was about 2% higher, up $9/ton to $448/ton.
P[L1] D[0x0] M[300x250] OOP[F] ADUNIT[] T[]
On a price per pound of nitrogen basis, the average urea price was at $0.39/lb.N, anhydrous $0.26/lb.N, UAN28 $0.37/lb.N and UAN32 $0.39/lb.N.
Last week, Dow Jones reported fertilizer prices are likely to be higher on average in 2021.
However, Dow Jones said fertilizer prices are expected to remain "subdued" compared to recent years because higher grain prices likely will support fertilizer demand.
"While new urea plants are due to come on stream in 2021, they might be delayed because of COVID-19," the Dow Jones article said.
However, the article noted that overall prices in 2020 will come in at close to multi-year lows on an annual average basis.
DTN collects roughly 1,700 retail fertilizer bids from 310 retailer locations weekly. Not all fertilizer prices change each week. Prices are subject to change at any time.
DTN Pro Grains subscribers can find current retail fertilizer price in the DTN Fertilizer Index on the Fertilizer page under Farm Business.
Retail fertilizer charts dating back to 2010 are available in the DTN fertilizer segment. The charts included cost of N/lb., DAP, MAP, potash, urea, 10-34-0, anhydrous, UAN28 and UAN32.
| DRY | ||||
| Date Range | DAP | MAP | POTASH | UREA |
| Oct 28-Nov 1 2019 | 464 | 472 | 383 | 402 |
| Nov 25-29 2019 | 456 | 465 | 381 | 386 |
| Dec 23-27 2019 | 443 | 454 | 377 | 378 |
| Jan 20-24 2020 | 413 | 435 | 374 | 357 |
| Feb 17-21 2020 | 410 | 435 | 373 | 361 |
| Mar 16-20 2020 | 408 | 433 | 370 | 382 |
| Apr 13-17 2020 | 410 | 433 | 370 | 384 |
| May 11-15 2020 | 413 | 433 | 370 | 388 |
| Jun 8-12 2020 | 406 | 430 | 363 | 367 |
| Jul 6-10 2020 | 405 | 427 | 360 | 360 |
| Aug 3-7 2020 | 416 | 430 | 357 | 354 |
| Aug 31-Sep 4 2020 | 431 | 442 | 348 | 361 |
| Sep 28-Oct 2 2020 | 439 | 459 | 338 | 362 |
| Oct 26-30 2020 | 448 | 477 | 332 | 358 |
| Liquid | ||||
| Date Range | 10-34-0 | ANHYD | UAN28 | UAN32 |
| Oct 28-Nov 1 2019 | 468 | 503 | 251 | 291 |
| Nov 25-29 2019 | 472 | 497 | 245 | 277 |
| Dec 23-27 2019 | 469 | 488 | 240 | 276 |
| Jan 20-24 2020 | 470 | 487 | 237 | 275 |
| Feb 17-21 2020 | 464 | 490 | 235 | 277 |
| Mar 16-20 2020 | 466 | 491 | 235 | 278 |
| Apr 13-17 2020 | 468 | 492 | 236 | 279 |
| May 11-15 2020 | 468 | 492 | 237 | 280 |
| Jun 8-12 2020 | 468 | 472 | 235 | 276 |
| Jul 6-10 2020 | 467 | 461 | 233 | 272 |
| Aug 3-7 2020 | 465 | 455 | 222 | 262 |
| Aug 31-Sep 4 2020 | 459 | 436 | 216 | 254 |
| Sep 28-Oct 2 2020 | 457 | 424 | 212 | 250 |
| Oct 26-30 2020 | 456 | 423 | 209 | 249 |
Todd Neeley can be reached at todd.neeley@dtn.com
Follow him on Twitter @toddneeleyDTN
(c) Copyright 2020 DTN, LLC. All rights reserved.


