

USDA Counting on Exports
Corn Exports Leaking, With Major Implications
USDA made only three changes in the corn, soybean and wheat supply and demand tables on Friday, Dec. 9. They dropped the average cash price for wheat by 10 cents to $9.10 and they cut projected corn exports by 75 million bushels (mb). The latter was widely anticipated and resulted in a 10-cent lower cash average price estimate of $6.70 for the year.
Any time you are losing demand, it pays to ask what caused it, is it over (the decline), and whether there are implications for prices out in the future. We leave technical and money flow considerations out of this piece, looking solely at the supply and demand value.
Why did USDA cut corn exports? Export sales through Dec. 1 were 48% smaller than a year ago. That is a deep hole to dig out of. Export commitments were also only 35% of the previous full-year forecast; they would typically be 51% by this date. The business just hasn't been getting done. Brazil is likely the main culprit. They had a record-large second crop harvested in June-August, and a high percentage of that crop gets exported (first crop goes more to livestock industry and processors).
P[L1] D[0x0] M[300x250] OOP[F] ADUNIT[] T[]
There has been a big "overhang" of Brazilian corn undercutting U.S. FOB prices. China is also creating competition for U.S. corn by now authorizing imports of Brazilian corn into that country. They had previously not been permitted due to unapproved varieties, etc. Several cargos have been shipped, taking away some U.S. market share. We shouldn't overlook plain old price rationing, either. U.S. cash corn prices are still the second highest ever for this date and that is just too expensive for some users around the world, and they are cutting back.
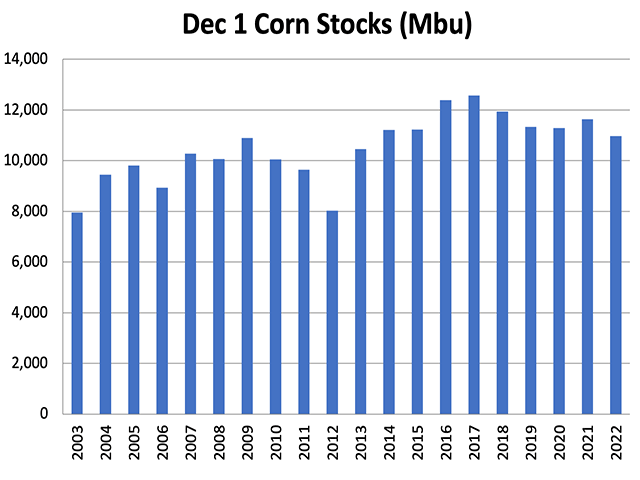
We can also look at Census export data for September and October and synthesize a November number from Export Inspections plus a fudge factor (inspections are usually light versus the official, but much-delayed, Census numbers). First quarter shipments appear to have been between 260 mb and 265 mb -- the worst first quarter total since 2012 (221 million) and close to the 2019 Trade War influenced 270 million. Final 2012-13 full year exports were only 730 mb. That's a far cry from the 2.075 billion projected today. USDA clearly thinks we can move a lot more corn than we did the last time we had really tight supplies and high prices. Is that rational? They seem to be a little optimistic yet.
On average, second quarter corn exports since the 2003-04 marketing year have averaged 4.2% larger than the first quarter; that would be 276 million for the second quarter. Third quarter exports have averaged 28.8% larger than the second quarter. The fourth quarter, on the other hand, is usually smaller at -7% of the third quarter figure. Applying those to the 265 million for first quarter would only give us 1.225 billion bushels (bb) for full year exports. That's the bear case.
The bull case is that recent years have seen a much more two-season year pattern, similar to the one in soybeans. South America does well in June-November and the U.S. does well December to June. Using just the last five years would project 1.512 bb for full year exports. Instead of the second quarter rebounding 4%, the more recent history suggests 27.9%.
Clearly, USDA is still counting on unusually strong export sales compared to other years, or at least a slow realization that they aren't coming. Weather and prices will have some influence there.
**
Comments above are for educational purposes only and are not meant as specific trade recommendations. The buying and selling of grain or grain futures or options involve substantial risk and are not suitable for everyone.
Alan Brugler may be contacted at alanb@bruglermktg.com
(c) Copyright 2022 DTN, LLC. All rights reserved.