

USDA Confirms WCB Thoughts
USDA Confirms Last Year's Western Corn Crop Was Smaller Than Thought
All fall I've been hearing from producers about very strong basis bids for corn in the Western Corn Belt. They argued that USDA had to be too high on corn production, that there wasn't any left out in the country. I wasn't hearing the same thing out east, but suspected USDA was going to have to make some adjustments. As it turns out, it's kind of like the story about the blind men and the elephant. Each was right about the part they were experiencing, but nobody was seeing the whole picture!
Starting with the big picture from Friday's USDA Grain Stocks report, old-crop corn stocks were still 142 million bushels (mb) larger than last year, but much tighter than expected coming into the report. The surveys put U.S. corn stocks on Sept. 1 at 1.376 billion bushels (bb). That is quite a drop from the 1.525 bb seen in the September World Agricultural Supply and Demand Estimates (WASDE) number. Probably because the residual use (it's gone but we don't know where it went) was getting too large to defend; NASS shrank the size of last year's crop to 15.074 bb, down 41.35 mb from the January number. They reduced planted acreage and harvested acreage, and also lowered their estimated national average yield to 176.7 bushels per acre (bpa) from 177.0 bpa. The biggest production revision was in Iowa, down 12.45 mb from the January number. There were no changes in the three Eastern Corn Belt states (Illinois, Indiana and Ohio).
My Western Corn Belt friends were also correct that farmers were further sold nationally than usual. On-farm stocks were only 63% of the total inventory, down from 68% last year at this time. However, on-farm stocks were larger than year ago, at 867.4 mb versus 839.6 mb. There was more corn out there, but farmers were tight holders.
P[L1] D[0x0] M[300x250] OOP[F] ADUNIT[] T[]
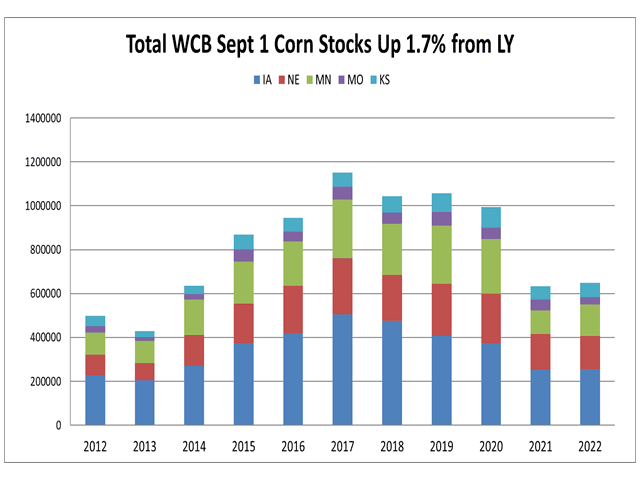
As mentioned above, total stocks were above a year ago, and that was true for the Western Corn Belt states as well as for the Eastern Corn Belt. It wasn't a lot. The graphic accompanying this article shows that Western Corn Belt stocks were up 1.7% in the five states we track under that label. Three were up from last year (Iowa, Minnesota and Kansas) while Nebraska and Missouri stocks were down. In Missouri's case, the supply coming into new-crop harvest was 30% smaller than last year. Nebraska stocks were the tightest since 2014.
All of this has basis and price implications. Corn is going to have to move in unusual directions, something immediately obvious if you look at your DTN Market Tracker cash bids. They are well over $8.00 in a band from Colorado down to Texas. Basis is 15 to 20 cents stronger in eastern Nebraska than in western Ohio. In many years it is the other way around. Rail rates are geared to move west to the Pacific Northwest or south to the Gulf. There's always a rail market to Hereford, Texas, but those trains are going to have to come from the north rather than Kansas (where NASS had September corn production down 16% from last year). Nebraska production in September was down 12%, year-over-year, and the local ethanol and feedlot operators are going to try to keep that grain from leaving the territory.
What about the U.S. balance sheet?
USDA cut corn production to make the balance sheet work, but the stocks tables don't tell us how they get from there to the ending stocks. They are going to have to either revise previous quarterly stocks numbers to reflect the smaller production or show a large fourth quarter feed and residual number to fit the ending stocks. If they have the fourth quarter feed and residual number do all the work, the fourth quarter could be 750 mb; That would be up from 612 million last year, but it would not be out of line with the 957 mb in the fourth quarter of 2020 and the 912 million in the fourth quarter of 2019. The fourth quarter feed and residual use number is notoriously volatile, because it is supposed to measure only old-crop use, while new-crop harvest begins in July in Texas. Both old crop and new crop are being fed, ground and exported in July and August. The Grain Stocks number explicitly measures only old crop in the bins, but some of that WASDE use for the year was actually new crop. The percentage can vary quite a bit, depending on how fast harvest goes, what southern yields are doing and how many bushels are in transit via rail or barge.
To wrap this up, old crop is history. That marketing year is over. The above helps us understand some market dynamics that will affect our local cash bids. Looking ahead to 2022-23 crop sales, the main impact of Friday's report was the smaller beginning stocks of 1.377 bb. Those are 148 mb tighter, equivalent to 1.8 bpa of lost new-crop yield using USDA's 80.8 million harvested acres from September. They make the stocks-to-use ratio a little tighter and the average cash price for the year a little higher. If NASS is forced to lower U.S. average yield further in October, that would magnify the tightness.
Alan may be contacted at alanb@bruglermktg.com
(c) Copyright 2022 DTN, LLC. All rights reserved.