

50 States Ranked on Ethanol Blending
DTN Ranks the 50 States by Ethanol-Blending Rates
LINCOLN, Neb. (DTN) -- For many years, ethanol opponents in the refining industry have called for the EPA to cut back on ethanol blending.
There just isn't enough gasoline consumed to be able to blend 15 billion gallons of ethanol annually, critics say, making their voices heard each time the agency holds public hearings on the Renewable Fuel Standard.
The latest U.S. Energy Information Administration data on transportation fuel consumption in the U.S. in 2021, however, paints a much different picture than refiners claim when they consistently call for ethanol blending below 10%.
Based on that analysis, DTN has ranked the 50 states and the District of Columbia by percentage of blend rates and uses total ethanol barrels consumed in each state as a tiebreaker to paint an interesting portrait geographically.
DTN's analysis of EIA data found an overall blending rate of 10.3% nationally, based on 332.01 million barrels of ethanol blended and consumed and about 3.2 billion barrels of gasoline.
In terms of gallons, the U.S. consumed 13.94 billion gallons of ethanol and 134.4 billion gallons of gasoline.
The EIA calculates ethanol and gasoline consumption in the commercial, industrial and transportation sectors, and not just from motor vehicles.
When you look inside the ethanol-blending rankings by state compiled by DTN, just nine states failed to blend ethanol at least at a 10% rate. That means more than 80% of the 50 states either hit or exceeded 10% ethanol blending in 2021.
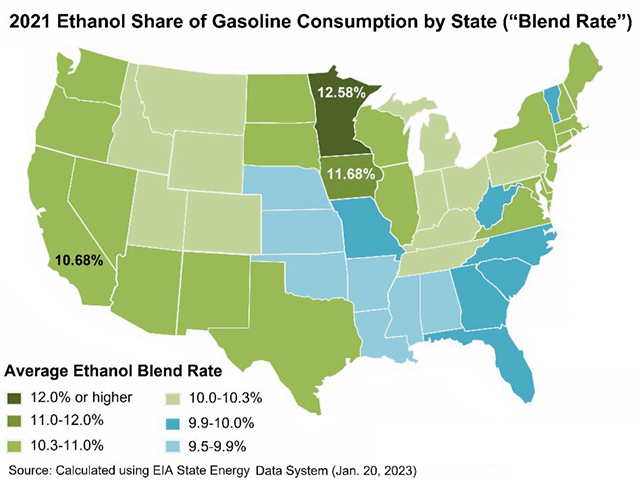
According to DTN's analysis, Minnesota and Iowa were the top two ethanol-blending states by percentage, although the total ethanol blended in those states was on the lower end of the scale.
Minnesota recorded a 12.6% blend rate followed by Iowa at 11.6%. Despite leading the country, Minnesota consumed just 7.15 million barrels of ethanol in 2021.
Texas is ranked third in the DTN analysis at a 10.7% blending rate, leading a logjam of 13 states and the District of Columbia at that rate because of a nation-leading 35.46 million barrels of ethanol consumed in Texas. California is right behind Texas in the rankings, consuming 34.1 million barrels of ethanol.
When you cross-reference the 50-state rankings with the leading states by ethanol-production capacity, some interesting things emerge, https://www.statista.com/….
Assuming ethanol producers in Iowa and Minnesota produced at full capacity in 2021, both states were large net exporters of ethanol, as is the case with most top-producing states.
Iowa would have blended just 177.2 million gallons of its 4.68 billion gallons produced. Minnesota would have blended and consumed about 300.3 million gallons of its 1.37 billion gallons produced in 2021.
On the flip side, although Nebraska is the second-largest ethanol-producing state, it comes in at No. 45 in the DTN rankings for ethanol consumption with a 9.7% blend rate in 2021.
The Cornhusker State consumed about 86.5 million gallons of ethanol in 2021, although the state's production capacity was about 2.35 billion gallons.
Though the states of Illinois, Indiana, South Dakota, Ohio, Kansas, Wisconsin and North Dakota were among the top 10 ethanol-producing states in 2021, in addition to Iowa and Minnesota, only Illinois and Wisconsin were in the top 20 ethanol-blending states in 2021.
Top 50 States for Ethanol Blend Rates, 2021: (tiebreaks with total ethanol blended in barrels)
1. Minnesota - 12.6%: 7.15 million
2. Iowa - 11.6%: 4.22 million
3. Texas - 10.7%: 35.46 million
4. California - 10.7%: 34.1 million
5. New Jersey - 10.7%: 8.76 million
6. Arizona - 10.7%: 7.45 million
P[L1] D[0x0] M[300x250] OOP[F] ADUNIT[] T[]
7. Washington - 10.7%: 6.45 million
8. Massachusetts - 10.7%: 6.23 million
9. Oregon - 10.7%: 3.8 million
10. Connecticut - 10.7%: 3.45 million
11. Nevada - 10.7%: 3 million
12. New Mexico - 10.7%: 2.58 million
13. Delaware - 10.7%: 1.24 million
14. Hawaii - 10.7%: 1.04 million
15. Rhode Island - 10.7%: 883,000
16. District of Columbia - 10.7%: 261,000
17. Maryland - 10.6%: 6.15 million
18. Illinois - 10.5%: 10.33 million
19. Wisconsin - 10.5%: 6.39 million
20. New Hampshire - 10.5%: 1.68 million
21. South Dakota - 10.5%: 1.23 million
22. North Dakota - 10.5%: 1.03 million
23. New York - 10.4%: 12.9 million
24. Maine - 10.4%: 1.62 million
25. Virginia - 10.3%: 9.72 million
26. Pennsylvania - 10.2%: 10.93 million
27. Michigan - 10.1%: 10.43 million
28. Tennessee - 10.1%: 8.02 million
29. Indiana - 10.1%: 7.35 million
30. Colorado - 10.1%: 5.44 million
31. Kentucky - 10.1%: 5.17 million
32. Utah - 10.1%: 2.92 million
33. Idaho - 10.1%: 1.96 million
34. Montana - 10.1%: 1.32 million
35. Wyoming - 10.1%: 785,000
36. Florida - 10%: 21.32 million
37. North Carolina - 10%: 11.28 million
38. Georgia - 10%: 11.17 million
39. Missouri - 10%: 7.43 million
40. South Carolina - 10%: 6.56 million
41. West Virginia - 10%: 1.9 million
42. Vermont - 10%: 660,000
43. Oklahoma - 9.7%: 4.36 million
44. Kansas - 9.7%: 2.91 million
45. Nebraska - 9.7%: 2.06 million
46. Alabama - 9.6%: 7.32 million
47. Louisiana - 9.6%: 4.99 million
48. Mississippi - 9.6%: 3.9 million
49. Arkansas - 9.6%: 3.46 million
50. Ohio - 9.5%: 11.24 million
51. Alaska - 0%
U.S. - 10.3%: 332.01 million
Todd Neeley can be reached at todd.neeley@dtn.com
Follow him on Twitter @DTNeeley
(c) Copyright 2023 DTN, LLC. All rights reserved.