

Corn Yield Check Up
Easy Formulas Estimate Corn Yields
DECATUR, Ill. (DTN) -- It's the time of year to take pre-harvest yield checks. Not only are in-field checks a good way to see if your crops measure up, but you can get a read on maturity levels and possible harvest problems lurking. Just remember yield numbers prior to harvest are a snapshot in time.
"When a lot of these early yields are being revealed by crop tours, some of the crop is still only at the R3, R4, R5 growth stages," said Purdue University corn agronomist Dan Quinn. "Even at R5 that corn plant still has about 30-days left to go and still has to pack on about 50% of its kernel weight."
There are several formulas that can be used to figure yields and one may fit a region better than another. Central Nebraska farmer Ethan Zoerb has pulled estimates and found some to be far from the mark. "Some formulas can run 40- to 50-bushel off to the low side for us because they are based on 90,000 seeds per bushel and we can typically run around 75,000 to 80,000.
"Our ability to add water late through irrigation contributes to that," said Zoerb.
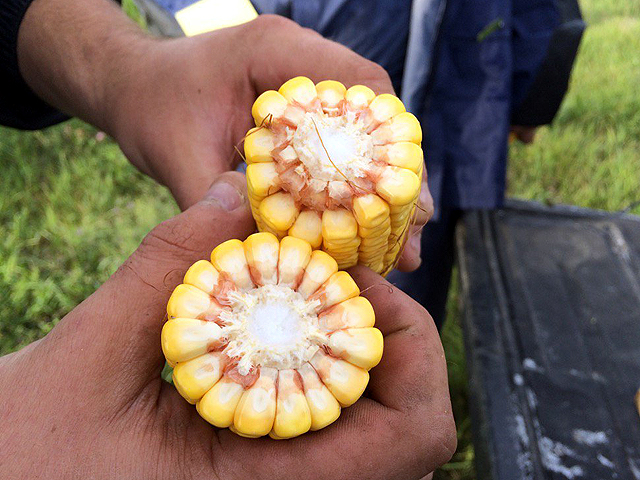
A range of possible yields based on kernel weights is one reason Quinn prefers what many call the Yield Component Method. Originally described by the University of Illinois, it is based on the premise that one can estimate grain yield from estimates of the yield components that constitute grain yield. These yield components include number of ears per acre, number of kernel rows per ear, number of kernels per row and weight per kernel.
Weight per kernel is the big question this time of year. Since that value isn't known until black layer, the formula uses some "fudge factors" to estimate kernel weight based on the standard premise that there are 90,000 kernels in a 56-lb bushel of corn.
Here's how the Yield Component Method works.
Step 1: Walk to a representative portion of the field and measure off a length of a single row equal to 1/1000th acre. For 30-inch (2.5 feet) rows, this equals 17.4 linear feet. For other row spacings, divide 43,560 by the row spacing (in feet) and then divide that result by 1,000 (e.g., [43,560 ÷ 2.5] ÷ 1000 = 17.4 ft).
Step 2: Count and record the number of ears on the plants in the 1/1000th acre of row that you deem to be harvestable.
Step 3: For every fifth ear in the sample row, record the number of complete kernel rows per ear and average number of kernels per row. Then multiply the ear's row number by its number of kernels per row to calculate the total number of kernels for each ear.
Step 4: Calculate the average number of kernels per ear by summing the values for all the sampled ears and dividing by the number of ears.
P[L1] D[0x0] M[300x250] OOP[F] ADUNIT[] T[]
Step 5: Estimate the yield for each site by multiplying the ear number (Step 2) by the average number of kernels per ear (Step 4) and then dividing that result by a kernel weight "fudge factor." Quinn recommends using a range of kernel weight values equal to 75, 85 and 95. "Those are the weights we most commonly experience in the central Corn Belt," he said.
Here's an example of how to do the calculation.
You counted 30 harvestable ears and 511 kernels per ear on average. Using the fudge factor values, the estimated range in yield for that sampled site would (30 x 511) divided by 75 = 204 bushels per acre (bpa), or divided by 85 = 180 bpa, or divided by 95 = 161 bpa.
To read all the detail behind this formula and some tips on how to measure oddly shaped ears, tip back and problem fields go to:
YIELD TOUR FORMULA
There is another simple formula often deployed by crop tours and originally developed by University of Minnesota agronomist Dale Hicks. It combines the use of several yield components (ears per acre and kernel rows per ear) with a measurement of ear length (a substitute for kernel number per row).
Here's how it works.
Step 1: Measure and record the row spacing (inches) used in the field.
Step 2: Walk past the end rows into the bulk of the field, then walk about 35 paces down the rows before taking a sample. You are looking for a representative sample of the field.
Step 3: Measure or step off 30 feet down the row. If you are doing a lot of sampling, a rope cut to length helps. Count all ears in the two adjacent rows. Divide that number by two and record your average ear count.
Step 4: Pull the fifth, eighth and 11th ears from plants in one row of the sampling area.
Step 5: Measure length of the portion of each ear that successfully developed kernels (do not include tip backed areas). Calculate the average ear length of the three ears in inches and record it.
Step 6: Count the number of kernel rows on each ear. Calculate the average kernel row number and record it. Kernel row number should be an even number.
Step 7: Grain yield is calculated by multiplying the average ear count by the average ear length by the average kernel row number, then dividing by the row spacing.
Here's an example of how to do the calculation. Let's say your sample had a 43.5 average ear count x 6 inches average length x 15.3 average kernel rows. Divided by 30-inch rows = 133 bpa yield estimate.
Search and you'll find several other methods, such as The Ear Weight Method described in this Ohio State University release https://agcrops.osu.edu/…. This formula can only be used after the grain is physiologically mature (black layer/30%-35% grain moisture) since it is based on actual ear weight.
The 2021 season has thrown some environmental curveballs, so getting out to sample fields is a good step. Again, just keep in mind that the corn crop isn't made at R5, Quinn said.
"These quick formulas will get you in the ballpark," Quinn said. "The big question this time of year is how that crop is going to finish."
The DTN/Progressive Farmer Digital Yield Tour, Powered by Gro Intelligence, which ran Aug. 9 through 13, paired state-of-the-art yield models from Gro with insights from farmers, agronomists and other experts in 10 states to paint a picture of state and national yields at that point in time. Find all the coverage of those yields here: https://spotlights.dtnpf.com/…
Tag along for a field view of what one farmer looks for when doing yield checks https://www.dtnpf.com/….
Pamela Smith can be reached at pamela.smith@dtn.com
Follow her on Twitter @PamSmithDTN
(c) Copyright 2021 DTN, LLC. All rights reserved.

