
Kub's Den
The Madman Theory of Commodity Pricing and Market Stability
"It is a very wise thing to simulate craziness at the right time." -- Niccolo Machiavelli, 1517.
This nugget of Machiavellian wisdom has been the origin of the "madman theory" of politics, supposedly used by President Nixon in 1969 and, some would argue, by Russia's Vladimir Putin in 2022. If you don't know how far an unstable person is willing to go, especially when that person has access to nuclear weapons, you may approach them more cautiously when bargaining.
It feels odd to say it, but commodity prices -- especially agricultural and food commodities -- have some of the same destructive power as nuclear weapons. Thousands could die across broad regions of the Earth if we cannot produce and distribute enough calories to the population. Distributing those calories very much depends on price; there are people in Egypt suffering from poverty who may be able to afford the government-fixed price for bread at 11.5 Egyptian pounds per kilo (equivalent to about $0.35 per U.S. loaf), but who might have to go without it if the price were 115 pounds. Egypt previously imported 80% of its wheat from Ukraine and Russia, so scarcity will be a problem while its supply chain is rerouted.
Sudden jumps in magnitude are something we are getting used to seeing in commodity prices. Think of nickel prices spiking to over $100,000 per ton at the London Metal Exchange last month amid a dramatic short squeeze; or think of WTI crude oil futures falling below $0 in April 2020 when storage facilities were full. Once the prices went past some logical, justifiable value, there was nothing to stop them from going even further. Once a market becomes unstable, you never know how far the other market participants are willing to go, just like a madman president with his finger on the red button.
P[L1] D[0x0] M[300x250] OOP[F] ADUNIT[] T[]
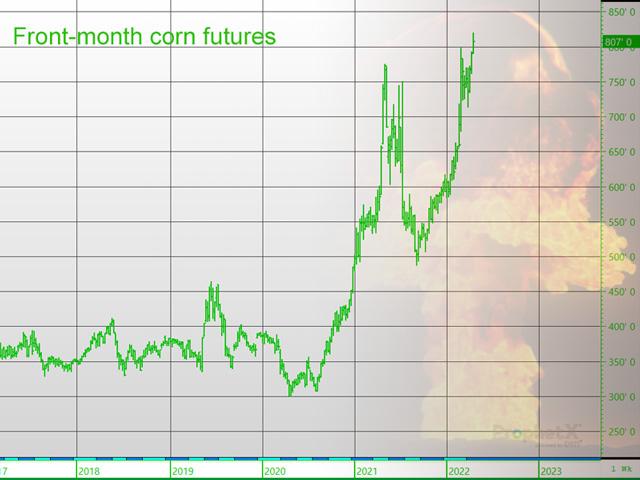
On April 20, 2022, nearby corn futures are at $8.03 per bushel and cash corn bids, too, have an $8 handle in several pockets of the countryside. Nearby soybean futures are $17.30 per bushel and nearby Chicago wheat futures are $11.02 per bushel. I would argue these are not crazy "madman" prices ... yet. An ethanol plant can justify paying $8 for corn when it can sell ethanol for $2.50 per gallon and DDGs for $290 per ton, and when its customers' customers (automobile drivers and livestock feeders) can afford to pay those prices and make money at whatever they're doing too. A soybean crush plant can justify paying $17 per bushel when it can sell soybean meal at $470 per ton and soybean oil at 80 cents per pound, and when there are no other viable substitutes for edible cooking oil that are any cheaper than that. Wheat has feed value that keeps it moving in line with other feed grains markets, but it also has its own special niche in flour and baked goods on grocery store shelves across the globe.
A 5-pound bag of all-purpose flour still only costs $1.56 (let's say that's equivalent to $18.72 per bushel if flour had the same density as wheat and was sold in bushels). But if you went to the grocery store and saw that a bag of flour cost $100, what would stop that price tag from rising even further? Anyone so desperate for flour that they would pay $100 might also pay $500 or $5,000. The market would drastically shrink in size and be limited to only a few madmen at that point, but when setting the price tag, you never know how high those few people might be willing to go.
Corn at $8 and soybeans at $17 might not be crazy, yet, but if soybeans go to $30 per bushel or $75 per bushel, what's to stop them from going to $300 or $750? Once the price tag is no longer justifiable by the economic case -- selling byproducts at affordable prices to end users -- it's divorced from reality. There are no limits.
There might be at least some speed bumps around the past highs noted on these charts, or "resistance levels," as the technical analysts would say. The continuous front-month corn futures chart has never previously traded higher than $8.43 3/4 (during widespread drought on 8/6/2012). Now, 10 years later, it's touched within 25 cents of that level before 90% of this year's seed is even in the ground.
The all-time high on the continuous front-month soybean futures chart was $17.94 3/4 on Sept. 4, 2012, and the continuous front-month Chicago wheat futures chart already sailed past its previous all-time high ($13.34 1/2 from February 2008) during last month's panic about the Russian invasion of Ukraine.
What would it take to push the row crops up into uncharted territory? Planting season and growing season in the Northern Hemisphere tend to be the timeframes when the grain markets get fresh bullish shocks about potential production problems, which add risk premium to the new-crop futures prices (and usually, some spillover panic to old-crop prices too). Already the low soil temperatures in the southern tier of the Corn Belt have delayed planting, and North Dakota is still buried under snow that's going to take a while to melt, so circumstances are pushing the markets closer and closer to the edge.
At this point, in late April 2022, all we can say is we're not at crazy, unjustifiable, unstable prices ... yet.
Elaine Kub, CFA, is the author of "Mastering the Grain Markets: How Profits Are Really Made" and can be reached at masteringthegrainmarkets@gmail.com or on Twitter @elainekub.ekub.
(c) Copyright 2022 DTN, LLC. All rights reserved.