

Kub's Den
Paying for Corn Storage: Are You Feeling Lucky?
It's awfully tempting to sell newly harvested corn around $5.60 per bushel these days, especially if you are a risk-averse business owner who appreciates a sure thing (cash money from the elevator) more than you appreciate a gamble. On the other hand, it may be equally tempting to hold on to unhedged corn until spring and see what happens, especially if you are a risk-seeking person who listens to the stories about inflation, fertilizer availability and everything else being said by market bulls.
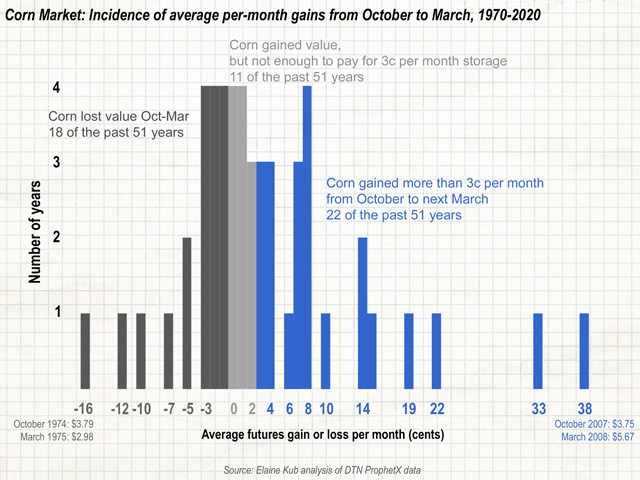
Corn prices do indeed behave with seasonality, often establishing their lowest marketing year prices around harvest and their highest marketing year prices in the spring or summer. Unfortunately, they don't follow this pattern very reliably. There are too many unknowns and too many external shocks that have nothing whatsoever to do with the seasonal supply of corn. In March of 1975, the price of corn had dropped to $2.79 after being $3.79 during the 1974 harvest (an average loss of 16 cents per bushel per month between October 1974 and March 1975). At the other extreme, in March 2008, corn futures had risen to $5.67 from $3.75 during the previous harvest (an average gain of 38 cents per bushel per month). That would've paid for storage! Last year was similar: $3.98 in October 2020 and then $5.64 in March 2021 (a gain of 33 cents per bushel per month).
Now, if a person stores today's harvested corn until next spring, without locking in a price for it, what are the chances that will be a successful flat price trade?
From a purely historical perspective, the chances of success aren't particularly great. In 29 of the past 51 years (1970-2020), corn prices either lost money between late October and the following March, or they stayed flat, or they gained just a penny or two per month -- not enough to reimburse the owner for the costs of storing the grain over five months. That leaves 22 of the past 51 years when corn's flat price gained enough between harvest and springtime to more than offset storage costs and accumulate outright profit from the speculation -- a 43% probability.
P[L1] D[0x0] M[300x250] OOP[F] ADUNIT[] T[]
That's slightly worse than your chances of winning a bet on either red or black at a casino's roulette wheel.
And, if your costs of storage are higher than 3 cents per bushel per month -- let's say 5 cents per bushel per month -- then only 16 of the past 51 years would have yielded enough gain for you to profit from the flat price speculation -- a 31% probability.
However, calculating this "probability" from the 1970-2020 data (table below) doesn't include some of the most influential considerations. What are the chances that corn prices will go up over the next five months, given that they are already historically high? What are the chances that they will go up, given that global shipping prices are currently elevated? We don't have enough years of history (especially not enough years when the corn price was $5.60 at harvest) to make those calculations.
| Year | Price in October | Price next March | Ave G/L per month (cents) |
| 1970 | $1.46 | $1.46 | 0 |
| 1971 | $1.16 | $1.24 | 2 |
| 1972 | $1.37 | $1.55 | 4 |
| 1973 | $2.39 | $2.77 | 8 |
| 1974 | $3.79 | $2.98 | -16 |
| 1975 | $2.78 | $2.65 | -3 |
| 1976 | $2.52 | $2.52 | 0 |
| 1977 | $2.14 | $2.56 | 8 |
| 1978 | $2.34 | $2.51 | 3 |
| 1979 | $2.65 | $2.58 | -1 |
| 1980 | $3.73 | $3.65 | -2 |
| 1981 | $2.87 | $2.74 | -3 |
| 1982 | $2.15 | $3.13 | 20 |
| 1983 | $3.45 | $3.53 | 2 |
| 1984 | $2.74 | $2.81 | 1 |
| 1985 | $2.33 | $2.35 | 0 |
| 1986 | $1.73 | $1.62 | -2 |
| 1987 | $1.79 | $2.10 | 6 |
| 1988 | $2.82 | $2.68 | -3 |
| 1989 | $2.37 | $2.61 | 5 |
| 1990 | $2.29 | $2.53 | 5 |
| 1991 | $2.51 | $2.64 | 3 |
| 1992 | $2.07 | $2.30 | 5 |
| 1993 | $2.58 | $2.75 | 3 |
| 1994 | $2.15 | $2.50 | 7 |
| 1995 | $3.32 | $4.09 | 15 |
| 1996 | $2.66 | $3.10 | 9 |
| 1997 | $2.80 | $2.59 | -4 |
| 1998 | $2.19 | $2.25 | 1 |
| 1999 | $1.99 | $2.36 | 7 |
| 2000 | $2.06 | $2.03 | -1 |
| 2001 | $2.05 | $2.02 | -1 |
| 2002 | $2.48 | $2.36 | -2 |
| 2003 | $2.47 | $3.20 | 15 |
| 2004 | $2.02 | $2.13 | 2 |
| 2005 | $1.96 | $2.36 | 8 |
| 2006 | $3.20 | $3.74 | 11 |
| 2007 | $3.75 | $5.67 | 38 |
| 2008 | $4.01 | $4.05 | 1 |
| 2009 | $3.66 | $3.45 | -4 |
| 2010 | $5.82 | $6.93 | 22 |
| 2011 | $6.47 | $6.44 | -1 |
| 2012 | $7.56 | $6.95 | -12 |
| 2013 | $4.28 | $5.02 | 15 |
| 2014 | $3.77 | $3.76 | 0 |
| 2015 | $3.82 | $3.51 | -6 |
| 2016 | $3.55 | $3.64 | 2 |
| 2017 | $3.46 | $3.88 | 8 |
| 2018 | $3.63 | $3.56 | -1 |
| 2019 | $3.90 | $3.41 | -10 |
| 2020 | $3.98 | $5.64 | 33 |
| 2021 | $5.68 |
Note, of course, that the decision to store or not to store may be very different for unhedged grain (a gamble on the overall market rising between now and spring) compared to the decision to lock in a price for spring grain, store that hedged grain and collect the certain "carry" from the futures roll (12 cents between the May 2022 futures contract and the current front-month contract). Even that decision -- to receive 2 cents per bushel per month for the next six months -- may not be enough to reimburse the owner for the costs of storing the grain and deferring the cash income.
The decision may also be influenced by your own opinion about how basis levels may change between now and springtime. You may expect to sell cash corn in March at $5.80 (0 basis) instead of now at $5.60 (13 cents under the December futures contract). That could improve the storage math, but basis movements are also uncertain unless you lock in the sale. Therefore, basis patterns weren't considered in the probability calculations above, just the front-month futures price at the end of October versus the front-month futures price at the end of the following March.
I fretted about presenting these results in nominal terms (cents per bushel per month) instead of relative terms (percent change over five months). Those 15 cents would be 7.5% of the value of a $2 bushel of corn but only 3% of the value of a $5 bushel of corn. However, corn's flat prices have been so stubbornly similar going back five decades that flat price comparisons for 2017 weren't really so different than 1995, 1981 or 1975. Anyway, elevators generally aren't charging storage fees in percentage terms, they're charging them as cents per bushel per month, so when it comes to making this decision, it's easiest to think of how many cents per bushel per month the market must gain to outweigh the flat cost of storage.
Let's say your local elevator is charging a "DP" (Deferred Pricing) fee of 3 cents per bushel per month to keep the price unset on corn you've delivered -- to let the market go up, you hope. If you decide to do that, you must hope the futures price goes from $5.75 today to at least $5.90 in March, just to break even on five months of DP fees. If your local elevator is charging 5 cents per bushel per month, you must hope the corn market gains at least 25 cents over the next five months and goes from $5.75 today to at least $6.00 in March. What are the chances of seeing $6 corn again?
Ultimately, this is a matter of individual risk appetite. The chances of seeing $6 corn again by springtime isn't zero but leaving your grain unhedged -- and your business's annual income uncertain -- is always a gamble.
Elaine Kub is the author of "Mastering the Grain Markets: How Profits Are Really Made" and can be reached at masteringthegrainmarkets@gmail.com or on Twitter @elainekub.
(c) Copyright 2021 DTN, LLC. All rights reserved.