

Kub's Den
Good Corn Conditions in June Don't Necessarily Mean Good Corn Yields
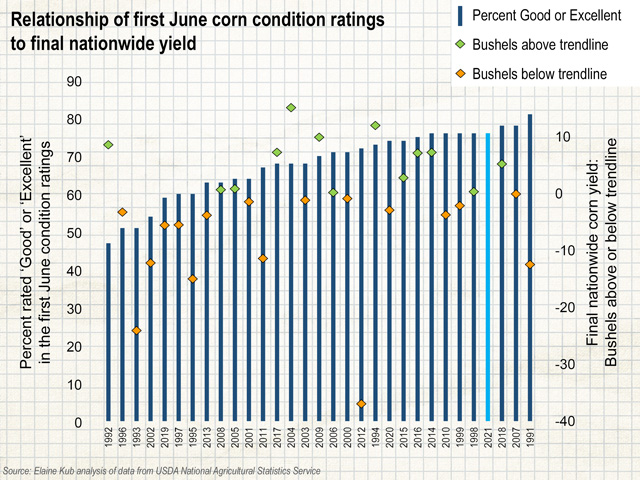
This week's Crop Progress report gave us a first look at corn's conditions ratings, with 14% of U.S. corn fields judged in "excellent" condition, 62% in "good" condition, 20% in "fair" condition, 3% in "poor" condition and only 1% in "very poor" condition. That's the third best kickoff to the growing season we've seen during the past 30 years, tied with 1998, 1999 and 2010. Only in 2007 and 2018 (78% rated "good" or "excellent" in those first sets of Crop Progress conditions ratings) and in 1991 (81% "good" or "excellent") did the U.S. corn crop get off to a more luscious start. Note, however, that 1991's promising conditions didn't ultimately translate into glorious yields. In fact, with a nationwide corn yield of 108.6 bushels per acre in the fall of 1991, that crop missed its trendline expectations by 12 bushels per acre.
While the market is trying to judge how large 2021 corn yields may be and how much corn the Northern Hemisphere will produce, it seems that condition ratings have limited predictive power this early in the season.
P[L1] D[0x0] M[300x250] OOP[F] ADUNIT[] T[]
The USDA's weekly Crop Progress reports are an extremely useful and robust tool for the market to watch throughout the growing season -- better than any alternative. If we just had a few self-interested brokerages and consultancies issuing their own private, biased opinions about crop conditions made after some limited windshield touring through a sample of the Corn Belt, that wouldn't be enough, and it wouldn't be publicly reliable for all market participants to access at the same time. Even satellite observations this early in the season don't necessarily capture all the signs of crop health that can ultimately affect yield -- not the way a trained, experienced army of USDA Crop Progress observers can. Sure, each of those observers are human and imperfect on their own, but through the power of averaging across hundreds of counties all across the countryside, the noise from individual observations gets smoothed out and turned into data with a high confidence of being accurate.
Some years (notably 2019), weird things happen, and confident predictions can't be made because the actual reality is so far out of sample and so different from anything seen before in history. But this year (2021), when USDA's nationwide numbers say 76% of the U.S. corn crop is in "good" or "excellent" condition, I'd say we ought to believe them.
It's a reliable, shared data point. But it may not tell us much about what U.S. corn yields will be this fall. Crop condition ratings are generally pretty good in June, because it's simply too early for anything to have gone wrong ... yet. Wait for July or August. Condition ratings are obviously also not meaningless when they show the details of specific regions that are struggling. The favorable nationwide average masks the bad story developing for North Dakota's dry corn fields (10% rated "poor" or "very poor") or the waterlogged conditions in parts of Kansas and Missouri.
Comparing the first June corn condition ratings from the past 30 years against each year's ultimate corn yield (how far it turned out above or below trendline expectations) is pretty unsatisfying. There is an almost meaningless correlation of 0.23 between the two data series. But not totally meaningless! Among those years that did have notably poor nationwide condition ratings right away in June (60% or less rated "good" or "excellent"), almost all of those years also turned out to have relatively poor final nationwide yields. Think of 1993, 1995, 2002 and of course 2019, when seed was planted in miserably cold, wet, compacted conditions.
It doesn't always work that way (1992 started with only 47% of corn fields rated "good" or "excellent" then went on to yield 9 bushels above trendline expectations on a nationwide basis). And the inverse frequently isn't true -- great nationwide conditions right away in the growing season don't reliably predict great nationwide yields at the end of the growing season. They may turn out well in some years (1994, 2014, 2016, 2018), or they may ultimately disappoint in other years (2007, 1991). Recall that the first June condition ratings for the 2012 crop showed 72% of the corn crop rated "good" or "excellent" but then the weather events of the summer ensued and the nationwide average yield of 123.1 bushels per acre was 37 bushels per acre below trendline expectations. Perhaps all we can conclude is that a bad start is bad, but a good start isn't much of a guarantee. A good start is merely the absence of a bad start.
Elaine Kub is the author of "Mastering the Grain Markets: How Profits Are Really Made" and can be reached at masteringthegrainmarkets@gmail.com or on Twitter @elainekub.
(c) Copyright 2021 DTN, LLC. All rights reserved.