

Canada Markets
Speculators Hold a Record Bearish Position in Canola
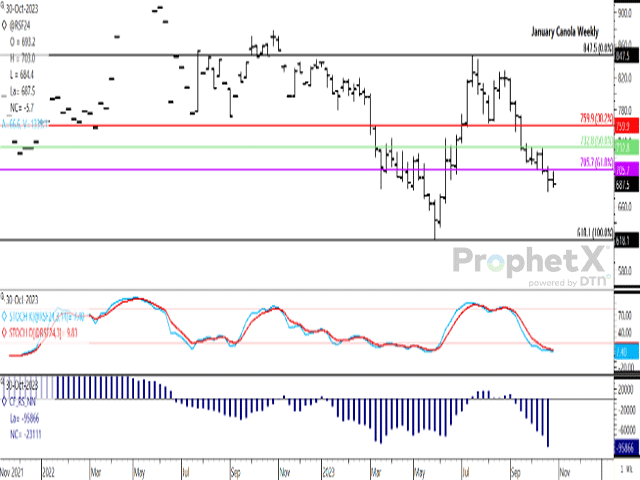
The January canola contract lost $5.70/metric ton to close at $687.50/metric ton (mt), following in the direction of soybeans, palm oil, rapeseed and crude oil, with Canadian dollar strength against the USD adding to the pressure. Trade continues to hold below the 61.8% retracement of the move from the contract's May low to July high at $705.70/mt. Trade on Monday saw the nearby contract fail to sustain a move above $700/mt for the second time in three sessions, while today's trade consolidated within last week's $29.90/mt trading range in a sideways move overall.
The first study on the attached chart shows the stochastic momentum indicators over-sold on the weekly chart, while the daily chart (not shown) shows an attempted break-out from over-sold territory for the second time in one week.
P[L1] D[0x0] M[300x250] OOP[F] ADUNIT[] T[]
Of particular interest is the actions of speculative traders, or noncommercial traders, as reported by the CFTC and shown by the blue histogram bars on the lower study. Over the week ending Oct. 24, noncommercial traders increased their bearish net-short position for a sixth consecutive week to 95,866 contracts net-short. While the CFTC only began reporting canola in 2018, this is a record net-short or bearish position.
The 23,111-contract increase in the net-short position seen over the past week is the largest week-over-week change in a net-short position seen since mid-March or seven months. This is the longest stretch of consecutive increases in the net-short position seen since February/March of this year.
A look at the ProphetX chart which plots the noncommercial long position for canola (not shown) shows this position at 56,558 contracts as of August 1, the highest level reported since April 26, 2022, or over 15 months, while this position has fallen to just 14,742 contracts as of Oct. 24, the lowest reported since Dec. 6, 2022.
While it is clear that speculators are prone to selling canola futures, prices are over-sold on the daily and weekly charts which could slow technical selling. Also, price could rebound quickly should this group become nervous for any reason, given the magnitude of their bearish holdings.
Cliff Jamieson can be reached at cliff.jamieson@dtn.com
Follow him on X, formerly known as Twitter, @CliffJamieson
(c) Copyright 2023 DTN, LLC. All rights reserved.