

Todd's Take
Should New-Crop Soybean Prices Be Higher?
Not only has it been a tough week for new-crop corn and soybean prices, 2023 has been a tough year altogether, so far. As of Thursday, May 18, December corn has fallen $1.10 per bushel to $5.00 3/4 and November soybeans are down $2.29 3/4 to $11.87. This will be remembered as the week when December corn prices dipped below $5.00 and November soybeans fell below $12.00, both representing important levels of support for the past two years.
The latest weakness in new-crop prices followed last Friday's USDA estimates, which predicted a record 15.26-billion-bushel (bb) corn crop, resulting in 2.22 bb of U.S. ending stocks in 2023-24. The new total is up from 1.42 bb in the current season and is the most in seven years. USDA's record 4.51-bb soybean crop sat atop a column of estimates that led to 335 million bushels (mb) of U.S. ending soybean stocks in 2023-24, up from 215 mb in the current season and the most in four years. With USDA's larger estimates in May, it's not surprising corn and soybean prices have been under pressure, but just how low do we expect them to go?
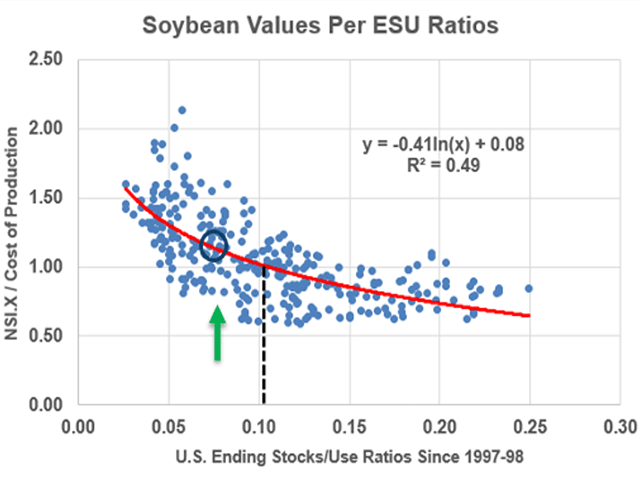
Before we dig into the numbers, I have to warn that the fundamental assessment I am about to offer is only one of many factors that affects market prices. In the case of corn and soybeans, the correlations of prices to USDA's ending stocks-to-use ratios are only 55% and 49%, respectively. In other words, prices have high levels of variability that have nothing to do with USDA's estimates of supply and demand. At best, the fundamental assessments give us a good idea of roughly where markets should trade under normal conditions. I'll leave the definition of normal up to readers.
With the above understood, USDA's 2.22-bb ending corn-stocks estimate represents 15.3% of annual use, a common metric for comparing corn supplies over time. Based on a 24-year history of DTN's national average of cash corn prices coupled with USDA's ending stocks-to-use ratios, the 15.3% ratio correlates with cash prices 14% below their cost of production.
P[L1] D[0x0] M[300x250] OOP[F] ADUNIT[] T[]
It is no secret that production costs spiked higher last year, related to increases in the costs of fertilizer, chemicals, fuel, labor, interest, etc. For corn, USDA's cost estimate translated to $5.25 per bushel in 2022. This year, the cost of fertilizer and fuel are roughly 35% lower, convincing me to start with a cost estimate of $5.00 per bushel. $5.00 times 0.86 is roughly $4.30 per bushel for an expected new-crop corn price. This early in the season, I'm reluctant to go that low and settle on $4.50 as a target price with adjustments to be made as we learn more about the new season.
For soybeans, the outlook is not nearly as bearish. USDA's estimate of 335 mb of U.S. ending soybean stocks represents 7.6% of annual use, a supply level that I already know has been historically profitable because it is below soybeans' dividing line at 10%. A 7.6% ratio corresponds to a national cash soybean price that is 14% above the cost of production. In this case, I am starting with a production cost estimate of $11.90 per bushel in 2023, down from the $12.54 USDA had for 2022. Take 1.14 times $11.90 and you get a target price of $13.60 per bushel for new-crop soybeans -- a price that seems too good to be true after watching November soybeans fall to Thursday's close of $11.87.
What are we to make of two statistical comparisons that give us a corn price that looks too low and a soybean price that looks too high? As I see it, the real value is to have respect for the downside risk in corn and to watch for signs of support in soybeans as it is quite possible noncommercial liquidation has exaggerated the recent selling in soybeans. At the same time, we have to remember that the ending stocks-to-use ratios for corn in 26 years of May World Agricultural Supply and Demand Estimates (WASDE) reports have an extremely low correlation of 19% to final farm prices. This early in the new season, estimates on the production sides and the demand sides of corn and soybeans are up for grabs.
Welcome to the guessing game of a new season when all the numbers are fluid and small changes can make big differences in price outcomes. No wonder we at DTN also pay attention to the actual price trends. The prices themselves are often the best clues we have. In the current market, the trends for new-crop corn and soybeans remain clearly down.
**
Register now for the upcoming DTN Ag Summit Series event, "Crop Updates From the Field." We will visit with farmers from across the country, talk about the latest dicamba and pesticide news and discuss DTN's latest weather and market outlooks. The program begins Tuesday, May 23, at 8:30 a.m. CDT. We understand if you're too busy to attend live. It will be available for replay; however, you must register before the May 22 deadline to gain access. Registration is free, and you can find more details here: www.dtn.com/agsummit
**
Comments above are for educational purposes only and are not meant as specific trade recommendations. The buying and selling of grain or grain futures or options involve substantial risk and are not suitable for everyone.
Todd Hultman can be reached at todd.hultman@dtn.com
Follow Todd Hultman on Twitter @ToddHultman1
(c) Copyright 2023 DTN, LLC. All rights reserved.