
WASDE Bulls Run Wild
Shock and Awe in Corn Market
USDA released a raft of numbers Tuesday morning, including the Crop Production annual, Winter Wheat/Canola plantings, the quarterly Grain Stocks report and the monthly World Agricultural Supply and Demand Estimates (WASDE), which attempts to synthesize all of the above. The grain markets were not confused by all the numbers -- they just bought everything in sight! Nearby CBOT Wheat was up 30 1/4 cents per bushel and soon-to-expire January soybeans were up 47 1/2 cents. However, it was the corn market that was locked limit up going home.
USDA cut expected marketing year U.S. corn use for 2020-21 by 250 million bushels (mb) compared to the December WASDE report, so it wasn't demand side revisions driving the limit-up move. Those numbers were reduced due to price rationing with buyers expected to cut purchases of corn or switch to substitutes (i.e. to wheat in China) because of higher prices. USDA hiked the projected cash average price for the year by 20 cents per bushel to $4.20. The real action was on the supply side.
What forced the bears into hibernation?
P[L1] D[0x0] M[300x250] OOP[F] ADUNIT[] T[]
As with any good shock and awe campaign, it was an overwhelming force. There were several different bullish revisions. NASS is still dealing with gremlins from their 2019 corn crop data. Whether due to flooding and massive prevented planting, COVID-19 data collection or staffing issues, the numbers have been off. You will recall the massive correction for the June corn stocks estimate that they put out on Sept. 30, retroactively dropping the stocks estimate more than 200 mb. Corn rallied sharply, and it was assumed the production or consumption corrections had been made. It turns out the numbers were still wrong. NASS hiked last year's feed and residual use estimate another 76 mb Tuesday and cut the carryover stocks by the same amount. That meant we started out the current 2020-21 marketing year with 76 mb less corn than we thought we had in December.
The big move was in 2020 crop production, which was cut 325 mb from last month's estimate. The national average yield was dropped 3.8 bushels per acre (bpa), the largest November to January revision USDA has ever had to make in either direction going back at least to 1974. NASS will tell you it was because they now had better data. They surveyed 77,706 producers for the December Ag Survey, which is three to four times the number they survey for the fall monthly crop reports. That's a lot more data points and they feel the farmer surveys are the most accurate data they get. That said, there must be some issues with the statistical models, satellite sensing and FSA number integration in the fall surveys if this large of a correction is necessary.
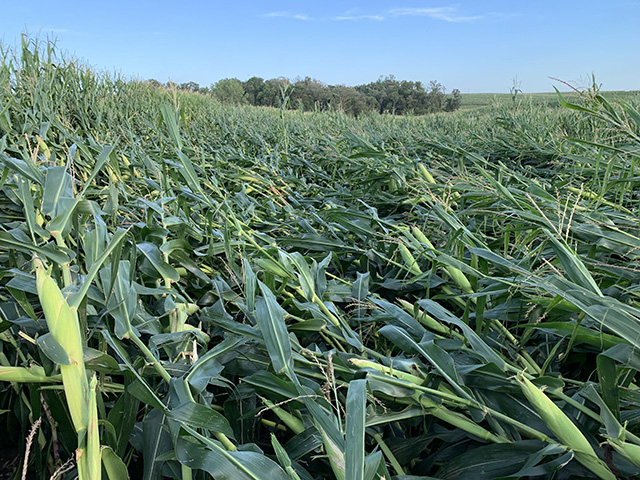
We don't want to blame the bureaucrats entirely for the problem, and recognize that, for many of you, a limit-up day prompts the response "what problem?" There was the little issue of the derecho back in August, essentially an inland hurricane that wiped out or damaged a wide swath of crops from Nebraska and South Dakota over to Indiana. Iowa took the worst beating; in fact, Iowa and Nebraska were the only traditional Corn Belt states with average yields lower in 2020 than in the 2019 flood-prone year. There was also a drought impacting some of the Corn Belt.
The below table highlights the NASS state average yield changes from November to this January report. Large revisions in small acreage states like Delaware are not all that unusual. However, you will note that they trimmed 10 bpa from Minnesota, supposedly the garden spot of the U.S. this year based on the weekly crop condition ratings. Only Kentucky was rated higher in the final condition ratings and Wisconsin was third. Yield there was also knocked down by 10 bpa in this report. Iowa, the principal derecho victim, was cut an additional 6 bpa this month, but that understates the damage.
| Nov-20 | Jan-21 | Change | |
| DE | 181 | 160 | -21 |
| PA | 152 | 138 | -14 |
| WA | 240 | 228 | -12 |
| TX | 139 | 128 | -11 |
| MN | 202 | 192 | -10 |
| WI | 184 | 174 | -10 |
| NY | 166 | 157 | -9 |
| VA | 131 | 122 | -9 |
| AL | 166 | 158 | -8 |
| CO | 122 | 116 | -6 |
| IA | 184 | 178 | -6 |
| ID | 205 | 199 | -6 |
| MI | 160 | 154 | -6 |
| ND | 145 | 139 | -6 |
| NC | 117 | 113 | -4 |
| NE | 185 | 181 | -4 |
| SC | 136 | 132 | -4 |
| IL | 195 | 192 | -3 |
| LA | 184 | 181 | -3 |
| OK | 138 | 135 | -3 |
| SD | 165 | 162 | -3 |
Our second table shows you how much different things could have been without the derecho. The first row shows projected harvested acres, yield and production for Iowa as of Aug. 1, before the storm. The second shows Tuesday's numbers.
| Harv Acres, Millions | State Avg Yield | Production (billion bu) | |
| August Iowa | 13.550 | 202.0 | 2.737 |
| January Iowa | 12.900 | 178.0 | 2.296 |
| Change | -.650 | -24.0 | .441 |
So, we find that Iowa producers either filed for crop insurance/abandoned or harvested for silage 650,000 acres that we intended to be harvested for grain back in August. The state average yield would have likely come down from 202 bpa based on the dry weather, but the 24 bpa decline left average yield 10 bpa lower than the flood depressed yield from 2019. Illinois had worse flood losses in 2019, but less derecho damage in 2020; their state average yield was 6.1 bpa higher than last year. Iowa production was down 441 mb from last expected in August. Using USDA's final harvested acreage figure of 82.467 million, the Iowa production loss lowered the national average yield by 5.35 bpa from where it would have been with all else unchanged.
Now that we've wrapped up this little statistical exercise, where does that leave us? USDA's $4.20 cash average price estimate implies a futures trading range for the marketing year of $3.78 to $5.15 if the range was the average since 1980, i.e. $1.37. We're at the top of that range. However, we also know that the range expanded to $2.92 in 2011 and $3.61 in 2012. How far we can expand it depends a lot on when South American new-crop corn hits the export market and in what quantities. Most of the Brazilian exports next summer and fall will come from the winter crop, which isn't planted yet.
Alan Brugler can be reached at alanb@bruglermktg.com
(c) Copyright 2021 DTN, LLC. All rights reserved.