

Cash Market Moves
Do You Know the Actual Cost to Transport Grain to its Final Destination?
The National Grain and Feed Association (NGFA), together with the USDA Agricultural Marketing Service (AMS) and Texas A&M Transportation Institute (TTI) hosted a webinar on Thursday, July 9, highlighting an in-depth look at the research and outcome of a study done by TTI on how congestion and wait times during the transportation of U.S. agriculture commodities can be costly, thus decreasing the producer's revenue, increasing export prices and making U.S. products less competitive on the world market.
In 2019, TTI conducted a study for AMS with the goal of identifying transportation costs associated with these goods. This research was developed to aid consumers in better understanding the importance of the transportation system and its effects on soybean and corn product prices.
It's not enough to know just the cost of a truck or rail rates or barge freight when moving corn or soybeans to market. Transportation costs include the base cost of transporting these products, as well as costs associated with delay. Delay consists of wait times and congestion. The study done by TTI encompassed the base transportation cost, additional transportation costs due to traffic congestion and costs with scheduling and loading delays each step of the process. And it can determine a farmer's bottom line.
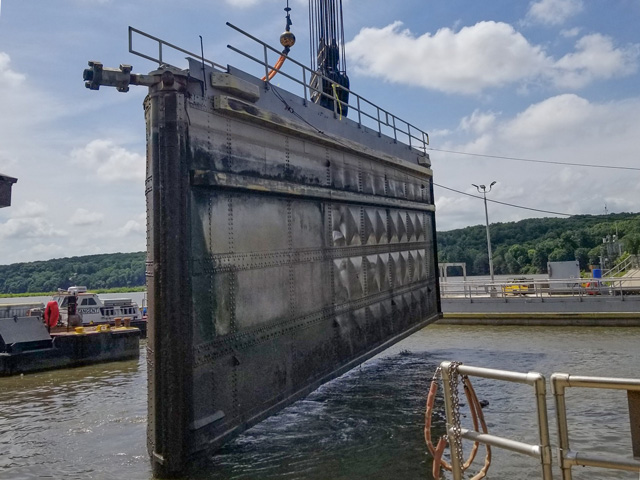
Wait times include delay accrued in fields, at elevators, and during transloading between trucks, railcars and barges. Congestion may occur with rail and barge transit due to weather, accidents, scheduled and unscheduled maintenance, shared use of track or reduced capacity at locks; traffic congestion on roadways produces greater costs and is less reliably dealt with than on other modes, noted the study. Efficient timing and scheduling can reduce delays with rail and barge, but highway traffic conditions are more volatile.
David Ellis, senior research scientist at TTI, explained during the webinar that, in order to estimate transportation costs, researchers calculated hourly transportation costs for truck, rail and barge traffic. These were then applied to origin, destination and travel information available for the soybean distribution chain. This calculation included a base transportation cost, an additional transportation cost due to traffic congestion, and costs associated with scheduling and loading delays at each step of the process. These numbers were then aggregated to provide a high and low estimate of the total transportation cost per ton for soybeans and soybean products for domestic and export markets.
P[L1] D[0x0] M[300x250] OOP[F] ADUNIT[] T[]
In his example for soybean products, Ellis showed that, while domestic soybeans did not show any variation from the low average to the high average, other soybean products showed a wide range of total costs of transportation. Export soybeans at the Gulf showed a range of $9.40 per ton to a high of $64.60 per ton. Soybean meal for feed showed a low of $8 per ton to a high of $70.23, while soymeal for export showed a low of $11.90 per ton to a high of $65.30. Biodiesel costs showed the widest range with the low at $7.30 and the high at $101.17.
Ellis said it is his hope that a new tool developed by TTI and USDA can help strengthen the industry's argument for transportation improvements. It is called M.A.R.K.E.T. (Measuring Agricultural Relevance of Key Expenditures in Transportation) and is free to use. It is designed to provide "high-level estimates" of the relative benefit to the grain sector of roadway infrastructure projects, inland waterways projects and improvements to multimodal facilities.
Here is a link to the tool: https://market.tti.tamu.edu/…
Ellis also noted that the agriculture industry needs to continue to push for infrastructure improvements on our roads, bridges and lock and dams. We all know what a failure of any of these can mean for transportation of farm goods at origin to final destination. Talk of infrastructure funding has become like a broken record; it is repeated over and over again without a plan actually put in place.
Here is a link to my story from July 6 on the latest talk of providing much needed funding for infrastructure: https://www.dtnpf.com/…
Transportation costs heavily factor into U.S. exports of soybeans and corn. Each mode of transportation provides advantages and challenges while providing flexibility in reaching markets. However, wait times and delays can affect transit time and incur additional costs, noted the study. Increased costs are then accompanied by increased export prices and decreased prices paid to farmers. Countries like Brazil and Argentina are investing in their transportation systems. For the United States to remain competitive in the international soybean and corn markets, transportation delays must be mitigated where possible.
"Everyone focuses on what infrastructure improvements will cost and not what it will cost not to make the investments," said Ellis. "There is a cost to do nothing."
Here is a link to the entire TTI study: https://www.dtn.com/…
Mary Kennedy can be reached at mary.kennedy@dtn.com
Follow her on Twitter @MaryCKenn
(c) Copyright 2020 DTN, LLC. All rights reserved.