USDA Acreage Report Analysis
Where Did All the Corn Go?
The prize for biggest surprise in Tuesday's USDA reports is clearly the planted corn acres number. The 92.006 million acres (ma) was almost 5 million acres below what producers told USDA in the March Planting Intentions report. Traders had expected the number to drop from March, for several reasons.
First and foremost, the 96.99 ma figure in March was well above all the estimates collected by the private industry analysts, raising suspicions that there was a flaw in the data. Secondly, COVID-19 issues erased a lot of local corn marketing opportunities in April and May through ethanol plant shutdowns. Livestock producers were also (and are still) having difficulties getting market-ready animals processed; that may have driven some to switch crops away from corn. Thirdly, the timeless soy-corn ratio for new crop had risen over 2.55:1 during planting, a traditional indicator that soybeans are more profitable than corn and that some swing acres are going the other way. Fourthly, the crop revenue insurance February price for corn was $3.88. That was 40 cents to 80 cents above local cash prices in late April and May, depending on basis. That was a strong incentive to claim prevented planting if you were already past your ideal planting dates and had sufficiently bad local weather to justify filing.
Traders had put two and two together and projected a drop to 95.14 ma from 97 ma. At least one analyst had 93 ma, but most were unwilling to drop it that much because USDA typically shows less than a 2-ma switch from March to June; cutting it 5 million seemed a bit ambitious.
P[L1] D[0x0] M[300x250] OOP[F] ADUNIT[] T[]
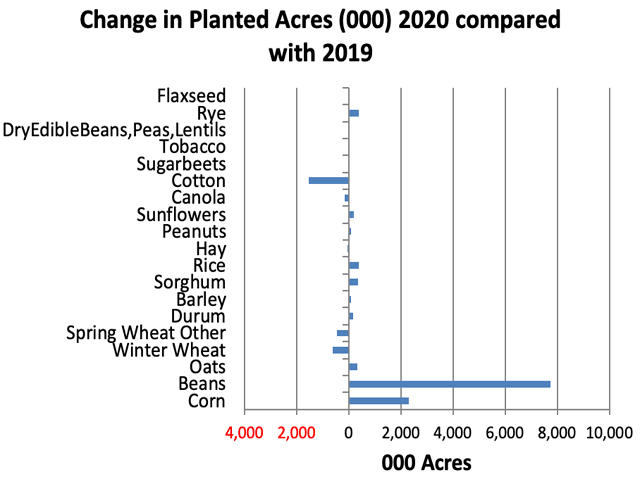
The whole switching equation was made even more complicated by the drier spring in 2020, with indications of rapid planting progress and most of the flooded-out acreage from 2019 coming back into production. You knew you were going to get more acres overall from the prevented planting reduction. As the graphic with this article shows, there are more corn acres and more bean acres than last year, and the acreage "leaving" corn intentions this spring didn't go to soybeans, at least according to the June 30 report. USDA shows 83.825 ma of soybeans, up only 315,000 from March intentions.
If the intended corn ground didn't go to soybeans, where did it go? Apparently nowhere.
If you add up all the primary crops in Tuesday's report, you get 312.244 ma. Since 2016, that demographic has been running 318-320 ma per year. It varies slightly depending on the percent of double-crop soybeans intended (they get counted twice) and on the number of acres tied up in either CRP or prevented planting. Last year, primary crops dropped to only 303.7 ma because of all the prevented planting. With PP and CRP added, the planted acreage base has been very consistent over the past three years.
Here's the issue: To get that 2020 bottom line in the right neighborhood (344 ma), we had to slug in 10 million prevented planting acres. While only half of last year, it is almost four times normal. Are those almost 5 million corn acres truly gone to prevented planting, just in hiding or not really there in March? We would argue that, while there were some weather issues in the Upper Midwest, including the Dakotas this spring, that won't get you to 10 ma of prevented planting. USDA does show that principal crops acreage in North Dakota was down 5.1% from last year and Texas is down 0.2%. Other candidates in the Delta, etc. were up from a year ago despite the usual flooding photos.
Did you hear about the 2.239 ma yet to be planted in corn and 12.1 ma for beans? Those were included in the header of the acreage report. USDA basically was letting everyone know how much of the presumed planted acreage was not, in fact, actually planted when the survey was closed on June 16. They have shown this info as a percentage in previous years, but not in such an obvious manner. The logic is that, if the weather turned bad, maybe some of it never got planted (signaling a future downward revision). On the other hand, that was as of June 16, and most of those fields were likely planted between June 16 and the report release date on June 30. It is common for some silage corn to be planted too late to make full maturity, but it is never intended to be harvested for grain anyway.
How do these unplanted figures compare to previous years? The 2020 corn figure was 2.43% of the reported acres. In the 2019 flood year, 16.7% of the considered planted acres had not actually been put in the ground yet. In the record-yield year of 2018, 1.6% remained to be planted.
The takeaway? Land is too expensive to sit idle, and it's doubtful there were enough wet areas to legitimately have 10 ma of prevented planting. However, we won't see prevented planting data from the National Farm Service Agency (FSA) until August, and it won't be complete for several months after that. It's likely the final soybean acres will creep higher than shown on Tuesday, and corn may even end up a little bigger. We're not rooting for either, as neither market needs the extra bushels.
Alan Brugler may be reached at alan.brugler@bruglermarketing.com
(c) Copyright 2020 DTN, LLC. All rights reserved.


