

2022 Digital Yield Tour Results
2022 Digital Yield Tour: Variable Weather Reduces Yield Prospects
Dave Walton farms in one of this year's rare garden spots: east-central Iowa. The grain and livestock farmer, near Wilton, says timely rains helped his crops flourish despite a recent week of temperatures near 100°F. Walton finished planting later than he wanted, around mid-May. Insect and disease pressure were light, and yield potential promising.
In early August, he thought his corn and soybean yields would meet or exceed his farm's recent annual production history (APH) of about 240 bushels per acre (bpa) for corn and about 65 bpa for soybeans in most fields.
Walton, who talks to farmers across the state and country through his roles with the Iowa Soybean Association and American Soybean Association, says, "It sounds like our spot in eastern Iowa ... and western Illinois ... is probably as good as it is anywhere in the country."
This year's DTN Digital Yield Tour, powered by Gro Intelligence, had similar findings.
WIDE VARIABILITY
The most well-watered regions of the country -- a swath of northern and central Illinois, northeastern Iowa and southeastern Minnesota -- show the strongest yield potential, but even there, it's average. Parts of Indiana and Ohio look like a checkerboard, reflecting the stop-and-go of a wet and cold spring.
The main theme west of the Mississippi River is drought, but there, too, are many regional differences in severity, timing and yield ramifications. Cooler temperatures and August rains may have helped some crops draft to the finish line, but others faced far slimmer chances of a revival.
"There have been so many weather concerns this year, but it hasn't been a consistent situation for many places," DTN Ag Meteorologist John Baranick says. "Some areas have seen really good conditions go south, while others that started poorly have made up some ground. Some have waffled in and out of poor and good conditions."
Gro Intelligence takes DTN/Progressive Farmer under the hood of its corn and soybean yield models for a week each August, making its county-by-county yield maps available without a subscription exclusively to DTN/PF readers. DTN reporters then pair Gro's data-driven insights with commentary from DTN experts and farmers to conduct the DTN Digital Yield Tour.
P[L1] D[0x0] M[300x250] OOP[F] ADUNIT[] T[]
This year, the tour estimated the national average corn yield at 167.2 bpa and the soybean yield at 48.9 bpa on Aug. 8. Gro's yield models update daily as new data becomes available. Machine learning helps the models compute what changes in satellite imagery, weather data, forecasts and more mean to the crop's outcome in each district and county in the nation's primary growing regions.
"The model provides a lot of granularities," Gro Intelligence Senior Analyst Jon Haines says, and this year's map reveals a lot of haves and have-nots. "It reminds me of something I've always heard: Variation is never a good thing for national yields."
Gro's yield forecasts are unique for August. Other organization's yield projections are based on farmer surveys and/or a combination of cherry-picked fields and statistics.
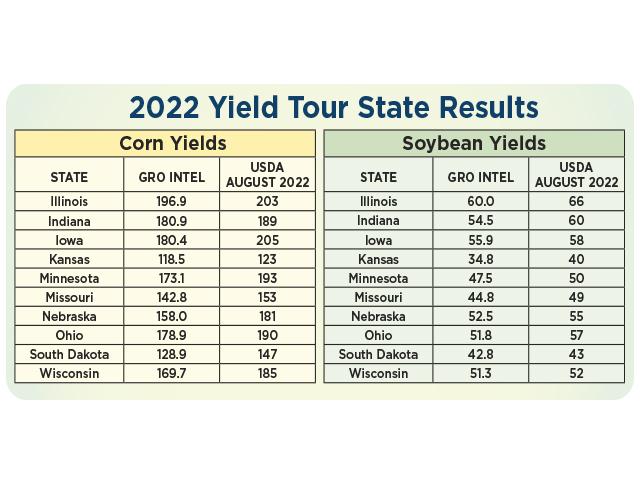
USDA's August "Crop Production" report, for instance, only incorporates its farmer surveys. That report forecast a 174.5-bpa national average corn yield and a 51.9-bpa soybean yield. USDA's estimates for the 10 states included in DTN's tour also came in higher than Gro's estimates.
That doesn't surprise Will Osnato, a senior analyst at Gro Intelligence. USDA usually waits until it collects and incorporates field-level data on things like ear length and kernel count before making big changes. Gro's methodology relies on a wider array of data. Its more frequent revisions mean it can narrow in when problems become apparent.
This year, the data isn't favorable. Land surface temperatures have been near historical highs. The NDVI (normalized difference vegetation index) map is trending below normal, reflecting higher temperatures, planting delays or some other combination of factors.
DETAILED ANALYSIS
Osnato says that in more than 20 years of back testing the model, Gro's final corn yield number is, on average, within 2% of USDA's final. The difference is that Gro finalizes its yield estimate in November, while USDA waits until January.
DTN Lead Analyst Todd Hultman says Gro's yield models help put the bigger picture into perspective. "I think Gro has done a remarkable job of giving us a much more detailed look at this year's corn and soybean crops," he says. Up until that week in August, all Hultman had to look at was USDA's "Crop Progress" report. It just doesn't compare.
"The 'Crop Progress' report gives a broad image or perception, but when Gro takes it under the microscope, we see a much more detailed picture of problems and crop stress, not only from state to state but within the states," he explains. "To have this kind of insight on every county in the growing area is just unparalleled and gives us a richer, more meaningful view of what's happening in the country right now. It's definitely changed my view on yield expectations this year."
-- Matthew Wilde, DTN/Progressive Farmer Crops Editor, contributed to this story.
**
FOR MORE INFORMATION:
-- Review the tour's findings on https://www.dtnpf.com/… and on Twitter using the hashtag #dtnyieldtour22
-- Digital Yield Tour: https://spotlights.dtnpf.com/…
-- Follow the latest from Matthew Wilde, Crops Editor, by visiting the Production Blogs at https://www.dtnpf.com/… or following him on Twitter @progressivwilde
-- Read Katie's business blog at https://about.dtnpf.com/…
-- You may email Katie at katie.dehlinger@dtn.com, or visit @KatieD_DTN on Twitter.
[PF_0922]
(c) Copyright 2022 DTN, LLC. All rights reserved.