

Todd's Take
USDA's May WASDE Estimates: Interesting, But Not So Helpful
Like the migration of swallows to Capistrano, Thursday brought a mass movement of market attention to USDA's World Agricultural Supply and Demand Estimates (WASDE) report for May, an annual ritual that kicks off a new season of guessing, long before anything too meaningful is known. I have nothing against rituals generally and get a kick out of guessing games as much as the next guy, but also want to be clear that the confidence level in the May report's new-crop estimates is not worthy of being used to make financial decisions.
That may sound harsh to some, but the longer I am around markets, the more important it becomes to separate the wheat from the chaff. Make no mistake, there is a lot of chaff in Thursday's new-crop estimates.
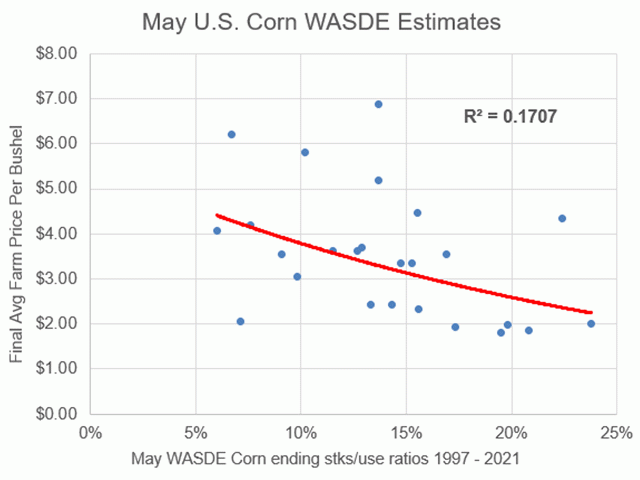
If you need convincing, I looked at USDA's initial estimates of U.S. ending new-crop corn stocks-to-use ratios in the May WASDE report over the past 25 years. I then compared those ratios to the final average farm price estimates USDA posted for the corresponding seasons. The result was a scatter chart with no discernable pattern. The statistical correlation of determination or R-squared value showed a slight negative correlation of 17% -- not strong enough to consider any significant relationship between the two variables.
That may sound ironic, because here at DTN, we go to a lot of effort to bring our customers the information in every WASDE report on a timely basis. I can think of at least 14 people in the newsroom -- there could be more -- directly involved in planning for the report, reporting the numbers and delivering the information as quickly as possible to our customers.
Now that there are no reporters locked in a room in Washington, D.C., with pre-written articles, at least four DTN reporters are in place to read and type out USDA's report information as quickly as possible, pass the copy to editors who then post the copy to the various platforms DTN news is delivered on. DTN Senior Analyst Dana Mantini puts together a quick audio report for listeners and I scramble to create a 12:30 p.m. CDT webinar in which I explain the key points of USDA's estimates for corn, soybeans and wheat and what it all means for the market.
P[L1] D[0x0] M[300x250] OOP[F] ADUNIT[] T[]
Mantini then goes to work putting out a more thorough review of USDA's numbers from an analyst's perspective. You can read it here: https://www.dtnpf.com/…. Depending on the month and what is happening, DTN may also invite a contributing analyst to add further comments. At DTN, we take all the WASDE reports seriously and work very hard to deliver the information accurately and promptly.
An important part of taking the information seriously, however, also means we have to assess the confidence level of the estimates presented. As Thursday's report now stands, USDA's estimate of 1.360 billion bushels (bb) of U.S. ending corn stocks for 2022-23 depends on a planting survey taken in early March, which may or may not be accurate, an unexpected judgment on yield skewed by slow planting progress in early May and demand projections that magically reach out 15 months into the future.
This year's new-crop estimates include the extra challenge of guessing what will happen in Ukraine and there is the perennial problem of estimating China's grain data. It doesn't take long to see May's new-crop estimates start out on thin ice. We shouldn't be surprised by the poor correlation to prices the numbers bear out.
Does that mean I think the big, 60-cent gains in Thursday's wheat prices were unjustified? Not necessarily. In the case of wheat, the market was already well aware that exportable supplies of world wheat were near their lowest levels in eight years and winter wheat crops in the Northern Hemisphere are much farther along than corn or soybeans.
U.S. problems of drought in the southwestern Plains and excessively wet fields in North Dakota and northern Minnesota are observable enough that USDA's estimate of 590 million bushels (mb) of hard red winter (HRW) wheat production was at least reasonable. We don't yet have a good estimate of spring wheat planting, but progress is clearly a problem in North Dakota and Minnesota where production can account for as much as two-thirds of the country's total.
Whether or not Ukraine will be able to export 367 mb of wheat and 354 mb of corn in 2022-23 remains to be seen. I don't fault USDA for making guesses about Ukraine, but clearly, it's an impossible task. The more important point is that we stay aware of the level of uncertainty behind the numbers. Thursday's estimates were not meant to be carved in stone and are not what I would call financially reliable.
My best advice for now is to stay humble about the things we don't yet know and keep a focus on the market's own clues. Currently, the price trends of corn, soybeans and wheat all remain bullish and I see little reason to argue. Thursday's May WASDE report was a fun game and got a lot of attention, but the uncertainty of the year ahead has not gone away.
**
Comments above are for educational purposes only and are not meant as specific trade recommendations. The buying and selling of grain or grain futures or options involve substantial risk and are not suitable for everyone.
Todd Hultman can be reached at Todd.Hultman@dtn.com
Follow him on Twitter @ToddHultman1
(c) Copyright 2022 DTN, LLC. All rights reserved.