
USDA Crop Progress Report
Corn Condition Gains Back 2 Points, Soy Condition Holds Steady in Latest Crop Progress Report
This article was originally posted at 3:06 p.m. CDT on Monday, Aug. 9. It was last updated at 4:02 p.m. CDT on Monday, Aug. 9.
**
OMAHA (DTN) -- Corn's good-to-excellent rating clawed back the points it lost the previous week, while soybean condition held steady last week, USDA NASS said in its weekly Crop Progress report Monday.
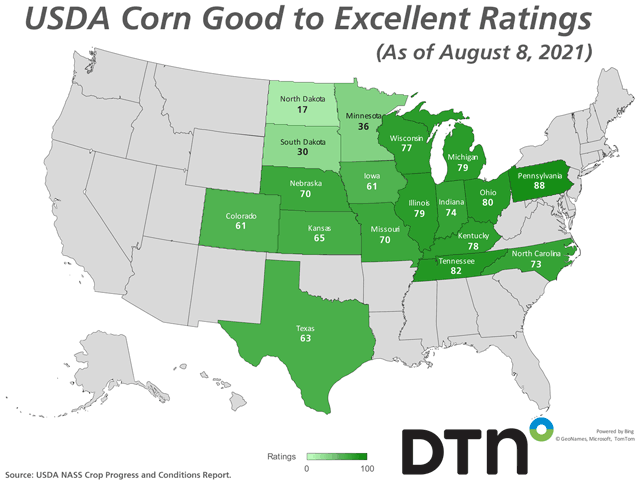
U.S. corn condition was back up 2 percentage points to 64% good to excellent as of Sunday, Aug. 8, after falling 2 percentage points the week before. The crop's current rating is tied with 2013 for the fifth-lowest good-to-excellent rating in the past 12 years.
The bulk of the gain in the national rating can be attributed to an 11-percentage-point gain in the rating for Illinois corn, said DTN Lead Analyst Todd Hultman.
Corn in the silking stage continued to run near average at 95% versus the five-year average of 94%, while corn in the dough stage was further ahead of normal at 56% versus the average of 51%. Corn reaching dent, on the other hand, was slightly behind normal at 8% versus the five-year average of 11%.
After rising the week before, soybean conditions nationwide held steady last week at 60% good to excellent as of Sunday. That is tied with 2017 for the third-lowest good-to-excellent rating in the past 12 years, Hultman said.
P[L1] D[0x0] M[300x250] OOP[F] ADUNIT[] T[]
"Half of the states showed a slightly lower soybean rating that was offset by an 11-percentage-point gain in the rating for Illinois," Hultman said.
Soybean development continued to run ahead of the average pace last week. NASS estimated that 91% of the crop was blooming as of Sunday, 2 percentage points ahead of the five-year average of 89%. Soybeans setting pods were pegged at 72%, 4 percentage points ahead of the five-year average of 68%.
The condition of the spring wheat crop inched up another percentage point last week to reach 11% good to excellent as of Sunday. That's still the lowest good-to-excellent rating since 6% in 1988.
"Sixty-one percent of spring wheat is rated poor to very poor, down from 64% last week," Hultman said. "Idaho has the highest-rated spring wheat crop at 31% good to excellent."
Spring wheat harvest accelerated again last week, jumping ahead 21 percentage points to reach 38% complete as of Sunday. That is 17 points ahead of the five-year average of 21%.
"Montana and South Dakota are leading the effort with 76% and 72% harvested, respectively," Hultman said.
Winter wheat harvest neared completion last week, reaching 95% as of Sunday, 4 percentage points ahead of the average of 91%.
"Montana has the most work left with 70% harvested, and Idaho is close at 71% harvested," Hultman said.
The following are some other highlights from this week's Crop Progress report:
Sorghum headed was 69%, 2 percentage points ahead of the five-year average. Sorghum coloring was pegged at 26%, 3 percentage points behind average. Sorghum condition was rated 63% good to excellent, up 1 percentage point
Cotton squaring was 88%, 7 percentage points behind the average. Cotton setting bolls was 63%, 5 percentage points behind the average pace. Cotton condition was rated 65% good to excellent, up 5 percentage points from the previous week.
Rice was 74% headed, 6 percentage points behind the average pace. Rice harvested was 7%, 1 percentage point behind average. Rice condition was rated 75% good to excellent, up 3 percentage points from the previous week.
Oats were 64% harvested, 7 percentage points behind average. Barley was 35% harvested, 11 percentage points ahead of the five-year average. Barley condition was rated 24% good to excellent, up 3 percentage points from the previous week.
**
To view weekly crop progress reports issued by National Ag Statistics Service offices in individual states, visit http://www.nass.usda.gov/…. Look for the U.S. map in the "Find Data and Reports by" section and choose the state you wish to view in the drop-down menu. Then look for that state's "Crop Progress & Condition" report.
| National Crop Progress Summary | ||||
| This | Last | Last | 5-Year | |
| Week | Week | Year | Avg. | |
| Corn Silking | 95 | 91 | 96 | 94 |
| Corn Dough | 56 | 38 | 56 | 51 |
| Corn Dented | 8 | NA | 10 | 11 |
| Soybeans Blooming | 91 | 86 | 91 | 89 |
| Soybeans Setting Pods | 72 | 58 | 73 | 68 |
| Cotton Squaring | 88 | 82 | 95 | 95 |
| Cotton Setting Bolls | 63 | 50 | 69 | 68 |
| Cotton Bolls Opening | 5 | NA | 9 | 11 |
| Winter Wheat Harvested | 95 | 91 | 89 | 91 |
| Spring Wheat Harvested | 38 | 17 | 14 | 21 |
| Sorghum Headed | 69 | 57 | 68 | 67 |
| Sorghum Coloring | 26 | 22 | 26 | 29 |
| Oats Harvested | 64 | 48 | 63 | 57 |
| Barley Harvested | 35 | 13 | 14 | 24 |
| Rice Headed | 74 | 59 | 73 | 80 |
| Rice Harvested | 7 | NA | 9 | 8 |
**
| National Crop Condition Summary | |||||||||||||||||
| (VP=Very Poor; P=Poor; F=Fair; G=Good; E=Excellent) | |||||||||||||||||
| This Week | Last Week | Last Year | |||||||||||||||
| VP | P | F | G | E | VP | P | F | G | E | VP | P | F | G | E | |||
| Corn | 3 | 8 | 25 | 49 | 15 | 3 | 8 | 27 | 47 | 15 | 2 | 6 | 21 | 53 | 18 | ||
| Soybeans | 3 | 10 | 27 | 48 | 12 | 3 | 9 | 28 | 48 | 12 | 1 | 4 | 21 | 57 | 17 | ||
| Spring Wheat | 29 | 32 | 28 | 10 | 1 | 30 | 34 | 26 | 9 | 1 | 2 | 5 | 24 | 57 | 12 | ||
| Cotton | 1 | 6 | 28 | 48 | 17 | 1 | 7 | 32 | 49 | 11 | 6 | 17 | 35 | 33 | 9 | ||
| Sorghum | 2 | 7 | 28 | 54 | 9 | 3 | 7 | 28 | 54 | 8 | 3 | 9 | 30 | 45 | 13 | ||
| Barley | 20 | 26 | 30 | 20 | 4 | 22 | 33 | 24 | 17 | 4 | 1 | 3 | 17 | 59 | 20 | ||
| Rice | 1 | 2 | 22 | 59 | 16 | 1 | 3 | 24 | 57 | 15 | 1 | 2 | 21 | 57 | 19 | ||
Anthony Greder can be reached at Anthony.greder@dtn.com
(c) Copyright 2021 DTN, LLC. All rights reserved.