

Todd's Take
USDA's Disappearing Cropland Problem
Before I can take one step toward the topic of trying to understand what happened to cropland in the U.S., I have to first acknowledge the good work of Dr. Scott Irwin, at the University of Illinois. On June 10, 2021, Dr. Irwin wrote, "Estimating Total Crop Acres in the US" (https://farmdocdaily.illinois.edu/…), followed by "Where Did All the Crop Acres Go?" (https://farmdocdaily.illinois.edu/…).
After USDA estimated lower-than-expected corn plantings at 92.7 million acres and lower-than-expected soybean plantings at 87.6 million acres on Wednesday, June 30, my primary interest was in the second article, "Where Did All the Crops Go?".
Like many, I had expected to see more corn and soybean plantings estimated Wednesday -- 93 million acres for corn and 90 million acres for soybeans. Looking at USDA's history of principal crops planted in previous Acreage reports, the data showed a total of 326.4 million acres planted in 2014.
In 2021, USDA estimated 317.2 million acres of principal crops planted, 9.2 million acres less than seven years earlier.
Just where the acres went in this year of uncommonly high prices is not so easy to explain. Acres in the Conservation Reserve Program (CRP) are down roughly 4.6 million in 2021 from 2014. Instead of helping solve the mystery, the lower CRP acres make the explanation more difficult.
Prevented plantings totaled 4.4 million acres in 2014. If the U.S. has 14 million acres of prevented plantings in 2021, then this case could be closed, but that high of a total doesn't seem likely, especially with this year's drier planting conditions in the northwestern U.S. Plains.
A closer look at principal crop acres showed corn and soybeans up 5.9 million since 2014, while wheat was down 10.1 million. Outside of the big three crops, the largest change by far was a loss of 5.6 million acres of hay production. The significant loss of wheat and hay acres was also an important finding in Dr. Irwin's second article.
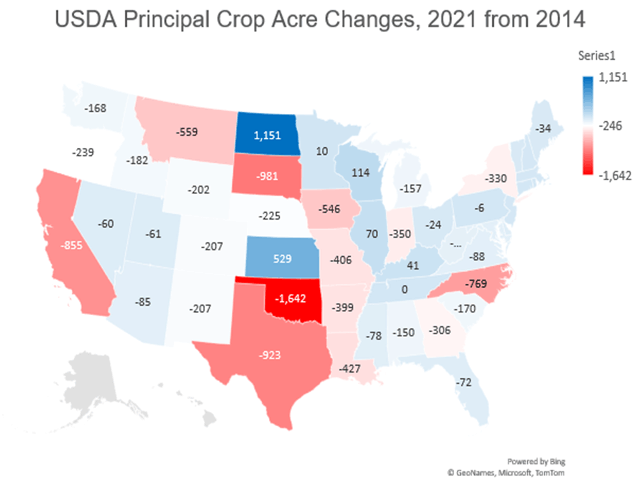
Looking for help, I turned to DTN Data Analyst and Grain Bid Manager Kathy Myers. Myers put together an interesting and colorful map, showing comparisons of principal crop areas for each state from USDA's revised 2014 data to 2021.
P[L1] D[0x0] M[300x250] OOP[F] ADUNIT[] T[]
Having the advantage of Wednesday's USDA report data, the state comparisons looked different than Dr. Irwin's map of changes from 2014 to 2020 and were interesting to consider.
First of all, the planted area of principal crops did not decline in all states. Two states with notable gains were North Dakota with an increase of 1.151 million acres and Kansas with a gain of 529,000 acres.
Admittedly, there were more states showing significant declines, but I doubt many would guess the largest decline of 1.642 million acres was found in Oklahoma, Kansas' neighbor. The second-largest reduction was 981,000 acres in South Dakota. If someone moved the state boundary lines, the changes would have been easier to explain, but I doubt that was the case.
The finding that the lost acres were largely wheat and hay seemed to make sense in Oklahoma and South Dakota. But increased acres in the big wheat states of North Dakota and Kansas added to the confusion. I needed to sit down and take a closer look.
Big acreage losses were also found in Texas, California, Montana and Iowa. Texas and Montana are also big areas of wheat and hay production, two crops sometimes planted on marginal ground. California has its own unique challenges and raised the question of growing urbanization.
After a closer look, all the states in the western Plains lost wheat acres and all but Kansas and Montana saw a decline in harvested hay acres. The states like North Dakota and Kansas that saw gains in planted acres did so because of their ability to substantially increase corn and soybean plantings. There were 2.1 million acres of corn and soybeans added in North Dakota over the seven-year period and 2.35 million acres were added in Kansas.
South Dakota showed a smaller 550,000-acre gain in corn and soybean plantings, while states like Montana, Texas and Oklahoma showed little or no increase in corn and soybean acres.
I was also reminded of a February article in DTN by Progressive Farmer Crops Editor Matthew Wilde, "Farmland Loss Threatens Food Supply" (see
Wilde cited a study by the nonprofit organization, the American Farmland Trust, which claimed, "From 2001 to 2016, 11 million acres of agricultural land were paved over, converted or fragmented..." The study didn't cover 2014 to the present day, but the trend of growing nonfarm use is likely an important factor in the decline we've seen the past seven years, even though many of the states showing large declines are still considered rural states.
Anecdotally, COVID-19 spurred a migration of many from urban areas to rural and could accelerate the loss of cropland in the future. Had COVID-19 emerged in 2014, the past seven years would have been easier to explain.
Dr. Irwin makes the point the acres that have gone out of production since 2014 could presumably return one day. Because we don't have a good explanation of why they disappeared in the first place, that remains a possibility. However, had the lost acres been viable candidates for corn or soybeans, there is a good chance we would have seen them this year.
I don't expect significant revisions to this week's USDA planting estimates, but the prevented acre totals due later this summer could prove interesting. For now, it is time to focus on weather again as 87.6 million acres of soybeans are not enough to meet the demand anticipated in 2021-22.
**
Comments above are for educational purposes only and are not meant as specific trade recommendations. The buying and selling of grain or grain futures or options involve substantial risk and are not suitable for everyone.
Todd Hultman can be reached at Todd.Hultman@dtn.com
Follow him on Twitter @ToddHultman1
(c) Copyright 2021 DTN, LLC. All rights reserved.