

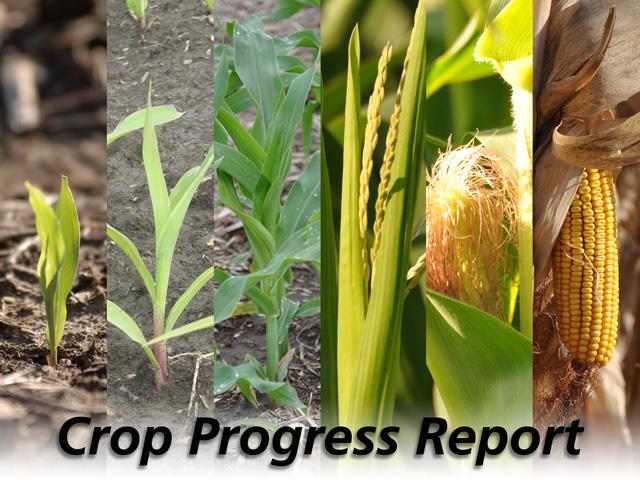
USDA Weekly Crop Progress Report
Corn 71% Good to Excellent; Soybeans 74% Good to Excellent
This article was originally posted at 3:05 p.m. CDT on Monday, Aug. 10. It was last updated at 4:18 p.m. CDT on Monday, Aug. 10.
**
OMAHA (DTN) -- Declines in Iowa's and South Dakota's corn condition ratings dragged down corn's national good-to-excellent rating slightly last week, USDA NASS said in its weekly Crop Progress report on Monday.
NASS estimated that 71% of the nation's corn crop was in good-to-excellent condition as of Sunday, Aug. 9, down 1 percentage point from 72% the previous week but tied for the third-highest rating in 10 years.
"A 4-point drop in Iowa and a 3-point drop in South Dakota helped pull this week's national good-to-excellent corn rating down 1 percentage point from last week," said DTN Lead Analyst Todd Hultman. "The highest good-to-excellent ratings were seen in Kentucky, Minnesota, South Dakota and Wisconsin -- all in the 80s."
P[L1] D[0x0] M[300x250] OOP[F] ADUNIT[] T[]
Corn silking reached 97% as of Sunday, 2 percentage points ahead of the five-year average of 95%. Corn in the dough stage jumped ahead 20 percentage points to reach 59%, 7 percentage points ahead of the five-year average of 52%. Corn dented was estimated at 11%, near the average of 12%.
While corn condition declined last week, soybean conditions continued to improve. NASS estimated that 74% of the nation's soybean crop was in good-to-excellent condition as of Aug. 9, up 1 percentage point from 73% the previous week. That is the highest national good-to-excellent rating for soybeans in at least 10 years for a second consecutive week, Hultman noted.
"Several soybean states posted small gains in ratings, which outweighed a 3-point drop in Iowa," Hultman said. "South Dakota and Minnesota had two of the higher ratings, at 85% and 84%, respectively."
As with the corn, soybean development continued to run slightly ahead of the average pace last week. Soybeans blooming was estimated at 92%, 3 percentage points ahead of the five-year average of 89%. The portion of the crop setting pods was estimated at 75%, 7 percentage points ahead of the five-year average of 68%.
Winter wheat harvest moved ahead another 5 percentage points last week to reach 90% complete as of Sunday. That remained 3 percentage points behind the five-year average of 93%.
"Oregon, at 77% complete, Washington at 55%, Montana at 45% and Idaho at 35% are the slowest," said DTN Senior Analyst Dana Mantini. "South Dakota is 95% done."
Meanwhile, spring wheat harvest picked up speed last week, moving ahead 10 percentage points to reach 15% complete as of Sunday. That was ahead of 6% at the same time last year but 10 percentage points behind the five-year average of 25%.
"South Dakota spring wheat harvest was leading the pack at 59% complete -- just ahead of its 56% average pace and up 24 points from last week," Mantini said. "Minnesota is 19% harvested, while North Dakota is just 7% done."
"Sixty-nine percent of the spring wheat crop was rated in good-to-excellent condition, down 4 points from the previous week, with the very-poor-to-poor category up 2 percentage points," Mantini said. "Key states Minnesota and North Dakota were 75% and 63% good to excellent, respectively. North Dakota fell 5 percentage points from last week. U.S. spring wheat ratings have now fallen 14 points from early June in the good-to-excellent category."
**
To view weekly crop progress reports issued by National Ag Statistics Service offices in individual states, visit http://www.nass.usda.gov/…. Look for the U.S. map in the "Find Data and Reports by" section and choose the state you wish to view in the drop-down menu. Then look for that state's "Crop Progress & Condition" report.
| National Crop Progress Summary | ||||
| This | Last | Last | 5-Year | |
| Week | Week | Year | Avg. | |
| Corn Silking | 97 | 92 | 87 | 95 |
| Corn Dough | 59 | 39 | 34 | 52 |
| Corn Dented | 11 | NA | 6 | 12 |
| Soybeans Blooming | 92 | 85 | 79 | 89 |
| Soybeans Setting Pods | 75 | 59 | 49 | 68 |
| Winter Wheat Harvested | 90 | 85 | 87 | 93 |
| Spring Wheat Harvested | 15 | 5 | 6 | 25 |
| Cotton Squaring | 96 | 91 | 97 | 96 |
| Cotton Setting Bolls | 71 | 54 | 72 | 70 |
| Cotton Bolls Opening | 9 | NA | 17 | 11 |
| Sorghum Headed | 70 | 55 | 56 | 69 |
| Sorghum Coloring | 27 | 23 | 25 | 31 |
| Oats Harvested | 65 | 49 | 43 | 59 |
| Barley Harvested | 16 | 5 | 12 | 32 |
| Rice Headed | 75 | 59 | 71 | 83 |
| Rice Harvested | 10 | NA | 6 | 9 |
**
| National Crop Condition Summary | |||||||||||||||
| (VP=Very Poor; P=Poor; F=Fair; G=Good; E=Excellent) | |||||||||||||||
| This Week | Last Week | Last Year | |||||||||||||
| VP | P | F | G | E | VP | P | F | G | E | VP | P | F | G | E | |
| Corn | 2 | 6 | 21 | 53 | 18 | 2 | 5 | 21 | 55 | 17 | 3 | 10 | 30 | 47 | 10 |
| Soybean | 1 | 4 | 21 | 57 | 17 | 1 | 5 | 21 | 58 | 15 | 3 | 10 | 33 | 46 | 8 |
| Spring Wheat | 2 | 5 | 24 | 57 | 12 | 1 | 4 | 22 | 62 | 11 | 1 | 7 | 23 | 57 | 12 |
| Cotton | 6 | 17 | 35 | 33 | 9 | 3 | 13 | 39 | 36 | 9 | 1 | 9 | 34 | 47 | 9 |
| Rice | 1 | 2 | 21 | 57 | 19 | - | 2 | 22 | 57 | 19 | 1 | 5 | 24 | 47 | 23 |
| Sorghum | 3 | 9 | 30 | 45 | 13 | 2 | 8 | 35 | 42 | 13 | 1 | 5 | 28 | 52 | 14 |
| Barley | 1 | 3 | 17 | 59 | 20 | 1 | 2 | 16 | 62 | 19 | - | 6 | 20 | 57 | 17 |
(c) Copyright 2020 DTN, LLC. All rights reserved.