

DTN 2020 Yield Tour
Digital Tour Hits Mark for Today's Virtual World
OMAHA (DTN) -- It's nice to be ahead of the curve, even when that curve is thrown at you due to unfortunate circumstances.
With the whole world turning to virtual meetings and events, we're fortunate that three years ago, DTN/Progressive Farmer linked up with Gro Intelligence to start the country's first virtual yield tour. The 2020 DTN/Progressive Farmer Digital Yield Tour, powered by Gro Intelligence, kicks off Aug. 10. It's our third annual high-tech look at the U.S. corn and soybean crops.
So, to grammatically improve an oft-used phrase, this isn't our first rodeo in using technology to replace carloads of tour scouts taking physical yield counts on a traditional yield tour. What we've learned in those three years is that a digital-based tour not only meant fewer bug bites and muddy boots, it also improved and added depth to investigating how the corn and soybean crops were shaping up.
The 2020 Digital Yield Tour will feature our fine-tuned combination of Gro Intelligence yield model estimates and "on the ground" reports from DTN and Progressive Farmer reporters and their sources. The combination provides one of the clearest pictures of the 2020 U.S. corn and soybean crop.
The timing of the tour, typically in mid-August, this year coincides with the Aug. 12 World Agricultural Supply and Demand Estimates (WASDE) report. So, in the middle of our state-by-state tour reports, we'll be providing our normal time-sensitive WASDE reports minutes after that data is released by USDA, which is scheduled for 11 a.m. Central.
P[L1] D[0x0] M[300x250] OOP[F] ADUNIT[] T[]
Our day-by-day schedule for the states covered on the virtual tour is: Aug. 10, South Dakota and Nebraska; Aug. 11, Kansas and Missouri; Aug. 12, Iowa, Minnesota and Wisconsin; Aug. 13, Ohio, Indiana and Illinois. The big reveal on overall national average yield estimates will culminate the week on Aug. 14.
Gro's yield models run constantly to update its yield projections. As in years past, we'll draw a line in the sand each morning, with DTN reporters digging into the yield projections for the appropriate states with Gro data experts. Our reporters will then discuss those state numbers with farmers, agronomists and other sources in those states to get that on-the-ground view that satellite images can't replicate. They'll also talk to DTN experts on weather and commodity analysis teams to get a well-rounded perspective on the numbers and what they portend for commodity markets.
It almost goes unsaid that, at this time of social distancing and limited travel, the ability to harness the power and consistency of a satellite's virtual view has become critical to DTN's efforts to help farmers and the grain industry plan for the 2020 harvest and grain-marketing seasons.
TECHNOLOGY BEHIND THE NUMBERS
As in previous years, our daily yield projections will be based on Gro's real-time crop analytical models. Gro Senior Vice President for Agribusiness James Heneghan explains their modeling system is based on a multitude of public and private crop and environmental data: normalized difference vegetation index (NDVI) from NASA satellite imagery, land surface temperature (LST) maps, rainfall (including DTN-supplied weather data), USDA crop condition surveys, crop calendars, planted and harvested acreage data from the National Agricultural Statistics Service (NASS), cropland data and U.S. government soil surveys.
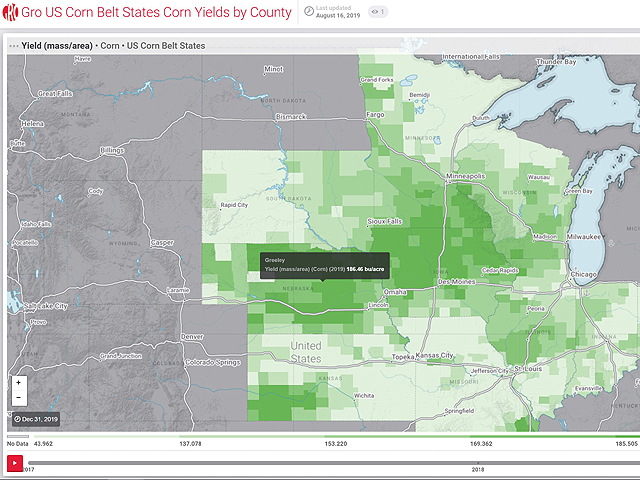
"Gro's datasets start at the county level, then build from county data into statewide and national yield outlooks," Heneghan said.
Each day's article will include links to Gro's state maps, allowing users to hover over counties they are interested in and get detailed yield and related numbers. As in previous years, this rare look into the Gro information factory will give readers unique insights made possible through the Gro/DTN partnership.
If you're new to the tour, or to Gro's methodology, Heneghan encourages readers to look through the website at www.Gro-intelligence.com and read the company's white papers on how the models were developed and other materials.
A new addition to our Yield Tour team is equipment maker Claas. The Germany-based company, which has its own history of bringing advanced technologies to agriculture, has signed on as official 2020 tour sponsor. That support is helping us expand our tour coverage into a series of podcasts and webinars that will dig deeper into what we're learning on the 2020 tour. Yield Tour podcasts will be part of our Progressive Farmer Field Posts Podcast series, found wherever you get your podcasts as well as in our Videos area at DTNPF.com.
You can also participate by following along on social media at #dtnyieldtour20. You can also add to the on-the-ground portion of the tour by posting your own yield checks and crop photos to that hashtag. You can also send your results to talk@dtn.com. You can find detailed information on how to take those yield checks along with other yield tour content next week at https://spotlights.dtnpf.com/….
(c) Copyright 2020 DTN, LLC. All rights reserved.