
Another Market View
Acreage Mystery Mostly Solved
As you may recall, the June 30 USDA Planted Acreage report shocked the market. Corn acreage was roughly 5 million acres below trade expectations going into the report, and the missing acres didn't show up in the soybean column as you might expect, given the rally in soybeans between March and June -- they just disappeared.
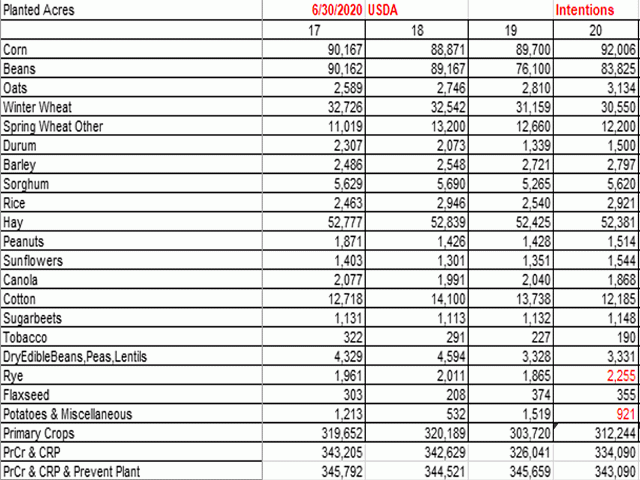
The chart featured with this article illustrates the point. Primary crops (third line from bottom of the table) in the U.S. typically total around 320 million acres, although they can go as high as 326 million when prices are high (i.e. 2012-2014). Because of flooding, that number dropped to only 303.7 million acres in 2019. We knew where they went, with prevented planting (PP) claims reaching a record-high 19.62 million acres. Adding in CRP and PP to the planted acres gets you to about 345 million each year, and we had that balance for 2019.
The right-most column in the chart accompanying this column shows the acreage figures released on June 30, and you can see they added up to only 312.244 million. That was up from 2019, but still well shy of the baseline 320 million. That left us wondering whether there were some hidden acres (likely soybeans) that were missed in June due to COVID-19 related reporting issues, that would show up later in crop production.
P[L1] D[0x0] M[300x250] OOP[F] ADUNIT[] T[]
Our second table (below) shows total prevented planting acres from FSA. We're using the August report data, not final, as we just received August 2020 to compare. PP acres have run from 1.2 million in a very dry year like 2012 to 9.2 million in the 2011 flood year. The average from 2011 to 2018 was 4.5 million per year. Adding 4.5 million to our 312.2 million planted gets you to 316.7 million. You are still about 4 million shy of the historical base. It would take 10 million acres of PP in 2020 to get our bottom-line acreage total to the average of 344-345 million. So where did they go?
| August Total Prevented Planting Acres | ||||||||
| State | 2014 | 2015 | 2016 | 2017 | 2018 | 2019 | 2020 | % Ch 19-20 |
| Illinois | 46,845 | 494,095 | 46,085 | 45,325 | 30,174 | 1,501,731 | 169,835 | -88.69% |
| Indiana | 24,340 | 165,159 | 35,605 | 43,605 | 22,314 | 944,215 | 58,457 | -93.81% |
| Iowa | 10,413 | 191,990 | 10,830 | 6,320 | 17,884 | 463,339 | 15,743 | -96.60% |
| Kansas | 92,587 | 159,254 | 12,785 | 147,060 | 36,924 | 628,812 | 256,174 | -59.26% |
| Minnesota | 694,165 | 43,223 | 16,829 | 42,000 | 58,710 | 1,170,579 | 246,915 | -78.91% |
| Missouri | 129,355 | 1,663,180 | 48,920 | 124,630 | 59,015 | 1,388,209 | 451,344 | -67.49% |
| Nebraska | 12,273 | 176,862 | 43,349 | 18,764 | 24,851 | 407,522 | 44,411 | -89.10% |
| Ohio | 62,333 | 135,979 | 15,639 | 35,843 | 45,647 | 1,485,919 | 63,480 | -95.73% |
| United States | 4,231,182 | 6,448,772 | 3,368,526 | 2,565,305 | 1,854,928 | 19,259,925 | 8,990,942 | -53.32% |
We had heard stories that producers were going to claim prevented planting due to the price differential between the spring guarantee and the market price, regardless of whether they could with (a clear conscience) prove that they couldn't get in the field. We were skeptical there would be that many legitimate PP claims, because this was not a flood year in the Corn Belt and wasn't even similar to the Missouri River Basin floods in 2011. Some North Dakota claims were expected, as they were still harvesting last year's corn in May because it was too wet to get in the field.
As you can see from the bottom right corner of our second table, FSA has now confirmed 8.99 million acres of PP for 2020. That is down 53.3% from last year, as ground came back into production, but is also the third largest prevented planting total after 2019 and 2011. Slugging that number into Table 1 for 2020 gets our total acreage to 343 million, leaving only about a million still unaccounted for.
Since the August planting and prevented planting totals are still several months from being final, the PP number could grow to cover most of the gap or we may see a little fine-tuning on some of the crops in October (when NASS traditionally uses "administrative data" to true-up the planted acreage in the Crop Production report). A quick comparison of August to final prevented planting totals since 2011 suggests the final number will be about 4% larger than the 8.99 million acres shown here.
If you've done a little math in your head, only 1.3 million of the 8.99 million acres of PP claims for 2020 have been in the big corn/soy states shown in the table. Three states (North Dakota, South Dakota and Arkansas) account for 4.8 million acres of this year's claims.
How much of the missing acreage was claimed as corn versus soybeans? The August report shows 5.38 million corn acres and 1.22 million bean acres. The decline in PP acres for corn (-52%) matches the overall decline (-53% year over year) in percentage terms. The bean claims are down 71.8% from last year, so maybe that 2.5:1 soy/corn ratio really did accomplish its objective of buying some bean acres. Or at least kept a few out of the prevented planting table!
Alan Brugler can be reached at alanb@bruglermktg.com
(c) Copyright 2020 DTN, LLC. All rights reserved.