
Todd's Take
How High Will Minneapolis Wheat Prices Go?
Any time a market has had a big move, it is a good idea to step back and ask some basic questions about value. After all, markets are emotional and, for a crop like this year's spring wheat, the forecast has been hot and dry for so long it is easy to lose track of how high prices have already come.
If you haven't heard by now, USDA reported Monday (July 22) that 11% of the U.S. spring wheat crop was rated good to excellent as of July 18, the lowest such rating since 1988 when only 7% of the crop qualified as good or excellent.
In the July 12 WASDE report, USDA estimated 119 million bushels (mb) of U.S. ending spring wheat stocks for 2021-22 or 24% of annual use. For spring wheat, that is the lowest U.S. ending stocks to use (ESU) ratio since 12% was posted in 2007-08. In the 2007-08 season, spot Minneapolis wheat hit an all-time high of $24.26 per bushel in February 2008 and finished the season at $10.55 a bushel.
I don't expect spot spring wheat prices to trade above $20 this season, but as we'll eventually see, $10 is not unreasonable. The 2007-08 season was a much tighter supply scenario than what is estimated today. It also helps to know USDA's ESU ratio of world wheat was 21% in 2007-08, much tighter than today's world estimate of 37%.
That brings up one of the difficulties of trying to put a value on U.S. spring wheat supplies. We can compare ESU ratios of U.S. hard red spring (HRS) wheat to past prices, adjusted for inflation, as I often do for corn and soybeans. However, the R-squared correlation value of those inflation-adjusted prices over the past 21 years to their ESU ratios is a pathetic 14%. That is not reliable enough for our purposes.
We are left to compare prices to other similar years, but in this case, we have to go back a decade. The 2011-12 season ended with a U.S. ESU ratio of 27% and a world ESU ratio of 29%. In that season, spot Minneapolis wheat prices posted a high of $11.20 in June 2011 and a second high of $9.85 3/4 in September 2011.
P[L1] D[0x0] M[300x250] OOP[F] ADUNIT[] T[]
I mentioned earlier that USDA's good-to-excellent crop rating of 11% is similar to the 7% rating USDA assigned in 1988. It may be interesting to know the highest spot price for Minneapolis wheat in 1988 took place in June at $4.60 per bushel. Adjusted for inflation, $4.60 works out to $10.59 a bushel in today's prices.
The big difference between now and the 1988-89 season is that HRS wheat supplies were more abundant then. USDA estimated 219 mb of ending spring wheat stocks in 1988-89, almost twice today's surplus and a whopping 59% of annual use. Based on 1988-89, we would expect wheat prices to be much higher today, but the world is too different to compare 33 years later.
We also need to keep in mind that the new 2021-22 season just started and USDA's 24% ESU ratio will change over the next 10 months. Here in late July, it is looking like there is room for USDA to cut its 305 mb production estimate even lower. The forecast for the northwestern U.S. Plains remains mostly dry with hot temperatures expected well into next week.
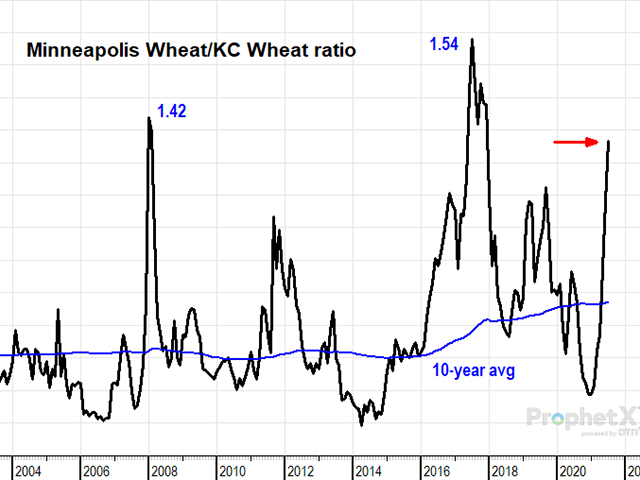
Lacking a confident valuation model, but getting the idea that $10 per bushel is not out of question for today's tight scenario, I turn to wheat spreads. Looking at the history of Minneapolis wheat prices in relation to the prices of the largest U.S. wheat crop, KC wheat, we see two notable peaks the past two decades.
The first peak was in January 2008 when Minneapolis wheat traded at 1.42 times the price of spot KC wheat. That happened the same month as the all-time peak of $24.26 per bushel. As previously mentioned, supplies of HRS wheat and wheat in general, were tighter in 2008 than they are today.
The more interesting peak in the Minneapolis/KC wheat ratio happened in July 2017, the time of spring wheat's previous drought. In spite of the drought, USDA's ESU ratio for 2017-18 ended at 40%, much higher than today's 24% ratio. Even so, Minneapolis wheat traded at 1.54 times the price of KC wheat in July 2017, a higher ratio than even the 1.42 of 2008. Also interesting, the drought in 2017 was not as damaging to crops as this year's drought is suspected to be.
On Thursday, July 22, Minneapolis wheat closed 1.38 times the price of KC wheat, not as high as either of the two previous peaks. It does seem Minneapolis wheat has room to trade higher in the current scenario as HRS supplies are tighter this season in relation to hard red winter (HRW) wheat supplies than they were in 2017.
If you're a little dizzy from all the comparisons, I apologize, but I hopefully succeeded in convincing you that there is no quick and easy fundamental way to nail down the answer of just how high Minneapolis wheat prices might go. I'm not joking when I say markets are people and people are emotional.
To sum up, I want to remind us the drought in the northwestern U.S. Plains is for real and more damaging to the spring wheat crop than any conditions in recent history. Ending stocks will likely finish the season at a 13-year low and that is extreme enough to expect more than an eight-year high out of prices.
Granted, Minneapolis wheat prices have come a long way and closed at $9.04 on Thursday. Producers should assess their cash needs, understanding there is risk in any market. Fundamentally speaking, $10 to $10.50 per bushel is not an unreasonable target for spot Minneapolis wheat in 2021-22.
**
Comments above are for educational purposes only and are not meant as specific trade recommendations. The buying and selling of grain or grain futures or options involve substantial risk and are not suitable for everyone.
Todd Hultman can be reached at Todd.Hultman@dtn.com
Follow him on Twitter @ToddHultman1
(c) Copyright 2021 DTN, LLC. All rights reserved.