Reviewing USDA's Wheat Acreage
Bigger USDA Wheat Acres Estimate a Surprise With Many Potential Impacts
Several of our post-USDA report columns have dealt with corn stocks or corn production, and USDA did shake things up a little Thursday, Jan. 12, with their 200-million-bushel (mb) production cut, which fueled a lower-than-expected Dec. 1 stocks number. However, we're going to break the tendency and talk about that other surprise in Thursday's reports: the 2023 winter wheat planted acreage. Corn and soybean producers -- stick with us because this is eventually about you as well.
The National Agricultural Statistics Service (NASS) surveys showed a whopping 11.1% year-over-year increase in winter wheat plantings last fall, at 36.95 million acres -- the largest total since 2015. U.S. winter wheat plantings have been declining since the 1960s, and this was the biggest year-over-year increase in winter wheat acreage since 2007. Traders had been looking for an increase, since prices last spring were the highest since 2007! However, there was still a full-bore drought underway in hard red winter (HRW) wheat country, and it was assumed lack of moisture would limit seedings a bit. Not so. By class, HRW was planted on 25.3 million acres, up 10% for the year. Soft red winter (SRW) wheat was seeded on 7.9 million acres, up 20% from last year. Winter white was on 3.73 million acres, up 3%.
P[L1] D[0x0] M[300x250] OOP[F] ADUNIT[] T[]
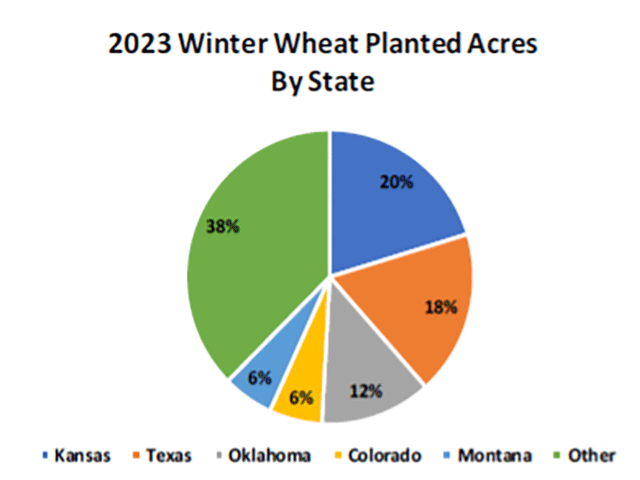
By state, Texas wheat acreage was up 26.4%, with Colorado up 12.8% and Oklahoma up 7%. Top producer, Kansas, increased a more modest 2.7% year over year, seeding 7.5 million acres. The graphic accompanying this column shows the percentage of the winter wheat crop by state. That "other" category reflects SRW and winter white acreage, 38% of the total. SRW plantings went into better soil moisture, and SRW acreage is the largest since 2014-15. There were some hefty year-over-year state increases there as well, with Ohio up 27.5%, Indiana up 55.2% and Illinois up 44.6% from 2022.
What are some of the implications? For wheat producers, higher winter acreage suggests higher production and potentially some rebuilding of depleted wheat stocks. That is, of course, assuming 1) we didn't have widespread winterkill during the bomb cyclone and 2) we get adequate moisture this spring to stimulate additional tillering. Both are big question marks!
If SRW sees average abandonment of 22% and the 10-year average yield of 66.07 bushels per acre (bpa), production would be up about 69 mb for that class. The impact is even more dramatic for HRW. Using 10-year average abandonment and yield, that 25.3 million acres could result in 760 mb versus only 531 mb last year. Spring wheat has yet to be planted, and prices can still adjust to discourage planting or encourage it, which could swing total U.S. production numbers a couple hundred million bushels.
Cattlemen, in theory, would have additional grazing opportunities. However, that only happens in the southern regions, the driest at the moment, and we're not hearing of much being available for grazing. Having $8 or $9 prices also tends to get any cattle that are grazing wheat to move off of it early, so as not to impair wheat yield.
For corn and beans? There are a few less acres than last year in the principal crops total that are available for planting something besides wheat. This doesn't necessarily mean fewer corn and soy acres, as surveys suggest cotton acreage will be down, but it is a limiting factor. On the other hand, double-cropping soybeans after wheat is popular in SRW country, and in HRW country, if the spring moisture is there. That 20% increase in SRW plantings leaves more room for double-crop beans. Last year's double cropping was expected to be 6% to 7% of total bean acres, due to the highest prices since 2012. It fell short, however, and the culprit is that lack of wheat ground to put them on.
Alan Brugler may be reached at alanb@bruglermktg.com
(c) Copyright 2023 DTN, LLC. All rights reserved.


