
Technically Speaking
Monthly Analysis: Livestock Markets
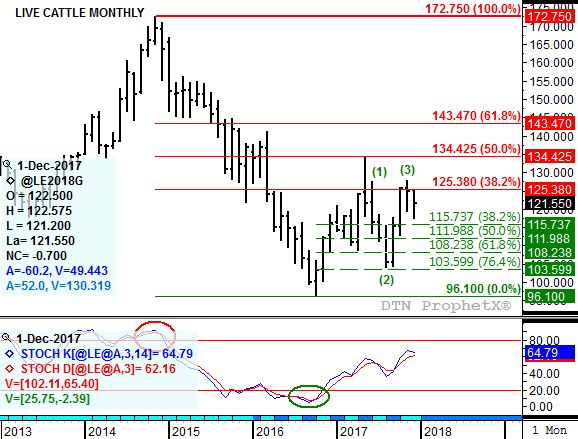
Live Cattle: The February contract closed at $121.55, down $3.425 on the monthly chart. Despite a second consecutive lower monthly close the market remains in a major (long-term) 5-wave uptrend. It's possible Wave 3 peaked at the November high of $128.875, if the spike high of $134.55 from May 2017 is discounted. This would put the Wave 1 peak at the June 2017 high of $127.65 with the Wave 2 bottom still at the August 2017 low of $104.20. If so, live cattle would be expected to see a third consecutive lower monthly close with Wave 4 testing support between near $115.75 and $112.00. Monthly stochastics remain bullish below the overbought level of 80%.
P[L1] D[0x0] M[300x250] OOP[F] ADUNIT[] T[]
Feeder Cattle: The March contract closed at $142.675, down $11.50 on the monthly chart. The market looks to be in a major (long-term) sideways trend between support at $139.075 and resistance near $164.725. Monthly stochastics are bearish, but below thee oversold level of 80%. If the March contract falls through support it would suggest, by simple measuring techniques, an extended sell-off to test the previous major low of $114.65 (October 2016) if not lower.
Lean Hogs: The February contract closed at $71.775, up $2.00 on the monthly chart. The market has resumed its major (long-term) uptrend as the Feb contract posted a new 4-month high of $72.45 during December. Next resistance is up near $87.05, a price that marks the 50% retracement level of the previous downtrend from $133.425 through the low of $40.70. Monthly stochastics are bullish below the overbought level of 80%, indicating the market has some room to the upside.
Corn (Cash): The DTN National Corn Index (NCI.X, national average cash price) closed at $3.15 1/2, up 5 1/2 cents for the month. The monthly close-only chart shows the NCI.X near trendline resistance at $3.18 3/4 heading into January. With the major (long-term) trend still down and the NCI.X secondary (intermediate-term) uptrend nearing an end, the projected March low monthly close near $2.97 still looks like a strong possibility.
Soybean meal: The March contract closed at $316.80, down $9.70 on the continuous monthly chart. The market remains in a major (long-term) sideways trend. Support is at $316.70, then $299.90. Resistance is at the July 2017 high of $348.70, then the January 2017 peak of $353.70.
To track my thoughts on the markets throughout the day, follow me on Twitter: www.twitter.com\DarinNewsom


Comments
To comment, please Log In or Join our Community .