

Technically Speaking
Weekly Analysis: Corn and Soybean Markets
Corn (Cash): The DTN National Corn Index (NCI.X, national average cash price) closed at $3.37 1/2, up 8 cents for the week. Cash corn looks to have reestablished its secondary (intermediate-term) uptrend with recent downtrend signals trumped by the market's major (long-term) uptrend. This has the NCI.X in position to test next resistance on its weekly close only chart at $3.42 3/4, a price that marks the 50% retracement level of the previous downtrend from $4.00 1/2 through the low of $2.85 1/4.
Corn (Old-crop Futures): The March contract closed 9.25cts higher at $3.64 1/2. Weekly stochastics continue to indicate the secondary (intermediate-term) trend is up. March corn looks to have cleared Initial resistance at $3.67 3/4, a price that marks the 33% retracement level of the previous downtrend from $4.53 1/4 through the low of $3.25, setting the stage for a test of the 50% retracement level near $3.89 1/4.
P[L1] D[0x0] M[300x250] OOP[F] ADUNIT[] T[]
Corn (New-crop Futures): The December 2017 contract closed 6.50cts higher at $3.99 1/4. The secondary (intermediate-term) trend remains up as the futures contract cleared resistance at $3.98 1/4. This price marks the 61.8% retracement level of the previous downtrend from $4.22 3/4 through the low of $3.58 1/2. The next target is the 76.4% retracement level of $4.07 1/2, though weekly stochastics are already above the overbought mark of 80%. This could possibly limit new buying interest. The contract's major (long-term) trend remains up on its monthly chart, with initial resistance pegged at $4.02, then $4.16.
Soybeans (Cash): The DTN National Soybean Index (NSI.X, national average cash price) closed at $9.83 1/4, up 32 cents for the week. A bullish crossover below the overbought level of 80% by weekly stochastics imply that the market has resumed its secondary (intermediate-term) uptrend. If so, next resistance is near $10.01 1/4 on its weekly close only chart. The previous high weekly close was $9.91 (week of January 17).
Soybeans (Old-crop Futures): The March contract closed at $10.59, up 32 cents for the week. It could be argued that the secondary (intermediate-term) trend has turned up again on the contract's weekly chart. Weekly stochastics posted a bullish crossover below the overbought level of 80%, indicating the contract could gain bullish momentum. If so, resistance remains between $10.69 3/4 and $10.89, prices that mark the 67% and 76.4% retracement levels of the previous downtrend from $11.35 1/2 through the low of $9.38.
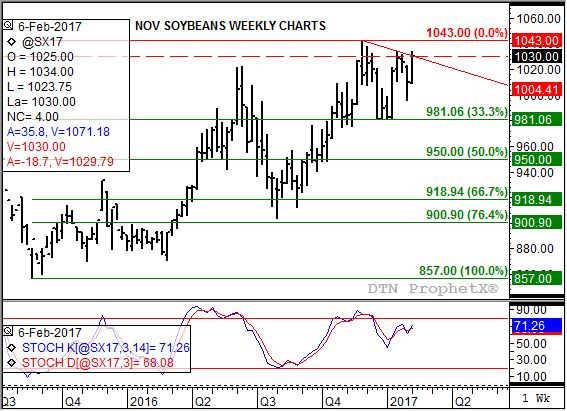
Soybeans (New-crop Futures): The November 2017 contract closed at $10.30, up 20 1/4 cents for the week. The contract is now showing a mix of signals, putting the secondary (intermediate-term) trend sideways. The contract posted a new 4-week high of $10.34 last week, usually an indicator of renewed bullish momentum. On the other hand, the last secondary signal by weekly stochastics was a bearish crossover by weekly stochastics indicating a downtrend. The contract closed at trendline resistance.
To track my thoughts on the markets throughout the day, follow me on Twitter: www.twitter.com\DarinNewsom

Comments
To comment, please Log In or Join our Community .