

Technically Speaking
Monthly Analysis: Grain Markets

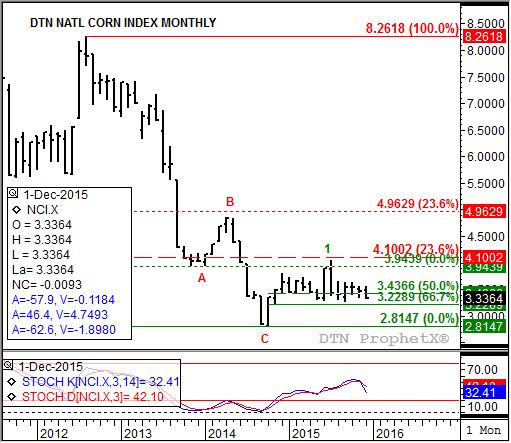
Corn (Cash): The DTN National Corn Index (NCI.X, national average cash price) closed at $3.34, down 12 cents for the month. While the NCI.X remains in its 5-wave major (long-term) uptrend, December's action established a bearish outside range meaning Wave 2 could now lead to a test of support near $3.23. This price marks the 67% retracement level of Wave 1 from the low of $2.8147 (October 2014) through the high of $4.0584 (July 2015). The 76.4% retracement level is down at $3.1082. Monthly stochastics are neutral-to-bearish above the oversold level of 20% indicating additional pressure could be seen.
Corn (Futures): The March contract closed at $3.58 3/4, down 13.50 cents on the monthly chart. While the futures market remains in a major (long-term) 5-wave uptrend (Elliott), Wave 2 could see the market fall below support near $3.50 1/4. This price marks the 76.4% retracement level of Wave 1 from the low of $3.18 1/4 (October 2014) through the high of $4.54 1/4 (July 2015). Next support is at the previous low. Monthly stochastics are neutral-to-bearish above the oversold level of 20% indicating continued pressure could be seen.
P[L1] D[0x0] M[300x250] OOP[F] ADUNIT[] T[]
Soybeans (Cash): The DTN National Soybean Index (NSI.X, national average cash price) closed at $8.19, down 18 cents for the month. The major (long-term) trend is sideways-to-down after the NSI.X failed to follow through on strength seen early in December. Support is at the previous low of $8.0857 (September 2015). Monthly stochastics remain in single-digits indicating a sharply oversold situation that could lead to renewed buying interest.
Soybeans (Futures): The March contract closed at $8.64 1/4, down 16.75 cents on the monthly chart. The major (long-term) trend remains sideways-to-down with support at the recent low of $8.44 1/4 (November 2015)). Monthly stochastics remain bearish below 20% indicating the market is in an oversold situation.
Wheat (Cash): The DTN National SRW Wheat Index (SR.X, national average cash price) closed at $4.25, up 2 cents for the month. The major (long-term) trend remains sideways-to-down with the SR.X testing support at the low of $4.11 (September 2015). Below that major support might be found at the March 2010 low of $3.73, then the October 2009 low of $3.17. Monthly stochastics are bearish below the oversold level of 20%.
SRW Wheat (Futures): The March Chicago contract closed at $4.70, down 5.50 cents on the monthly chart. The major (long-term) trend is sideways with support between $4.70 and $4.60, a range housing a series of lows dating back to September 2014. Below that is the June 2010 low of $4.25 1/2.
To track my thoughts on the markets throughout the day, follow me on Twitter: www.twitter.com\DarinNewsom
Comments
To comment, please Log In or Join our Community .