Technically Speaking
Dec(onstructing) Corn
When the opening bell to the CME Globex overnight session rings Sunday evening (7pm CT), marking the beginning of another week of trade in grains, all eyes will be on the December corn. The talk heading into this weekend was of rain in the extended forecast, moisture that if it happens will come into play later this coming week.
From a DTN 6 Factor point of view, Dec corn is showing a mixture of signals. Let's take the contract apart to see what could happen.
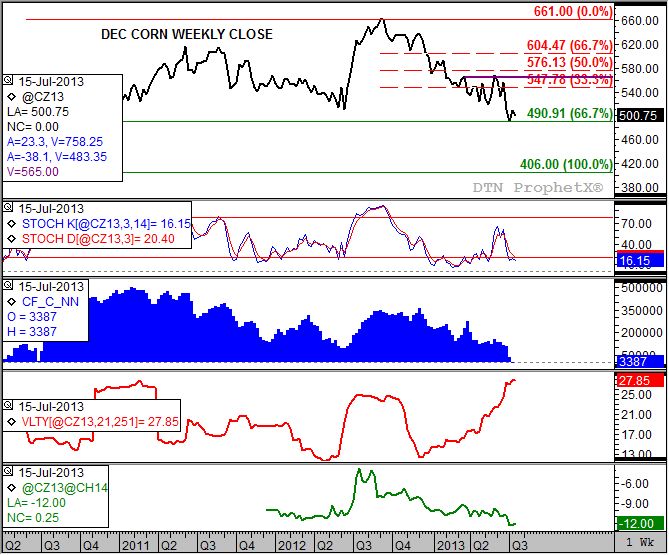
As the top chart shows, the trend (price direction over time) in Dec corn has been down. Recently, the contract has stabilized near technical price support at $4.90 (weekly close only). This price marks the 67% retracement level of the previous uptrend from $4.06 (week of June 1, 2010) through the high of $6.61 (week of September 4, 2012). Weekly stochastics (second study, momentum indicator) reflects this same sideways trend with both the faster moving blue line and slower moving red line both near the oversold level of 20%. However the last major crossover was bullish, occurring the week of March 15, 2013 as the blue line crossed above the red line below 20%. This would mean the contract would be expected to move to a more consistent uptrend.
P[L1] D[0x0] M[300x250] OOP[F] ADUNIT[] T[]
In order to do so, noncommercial traders will need to show increased buying interest. This group's once large net-long futures position reported in the weekly CFTC Commitments of Traders report (third study, blue histogram) has been declining since the week of December 3, 2012 when it hit 359,273 contracts. Recently, this group had not only been whittling back its net-long position but actually moved to a net-short position of 3,446 contracts the week of July 8. This was time the position had been net-short since the week of December 18, 2005. However, the latest CFTC report (week of July 15) showed a move back to a small net-long of 3,387 contracts.
A factor that could limit continued noncommercial buying is the steady increase in market volatility (fourth study, red line) for December corn. As of last Friday's close, weekly volatility was calculated at about 27.9%, its highest level on the weekly close chart. Normally, high levels of market volatility cools investor buying interest because of the increased risk it creates. But, this group chases headlines like cheap lawyers chase ambulances, so a week of possible bullish headlines could spark at least some adding to the net-long futures position.
Outside of the reaction to weekend weather, the first set of headlines should come late Monday with the release of NASS' weekly crop condition report. Last Monday's numbers resulted in a DTN Crop Condition Index (not shown) of 162 points, down from the previous week's 167 points reflecting the first substantial decrease of the 2013-2014 growing season. The five-year seasonal index shows this index tends to trend lower through early harvest, meaning investment traders could grow more bullish on headlines talking of reduced production potential.
For a look at the real opinion of market fundamentals though, we use futures spreads. In this case, the December to March spread (fifth study, green line). The trend in this spread has been down, meaning the carry has steadily strengthening reflecting an increasingly bearish commercial view of new-crop supply and demand. Last Friday's close at the 12 cent carry level was 1/4 cent less than the previous week. If this group believes crop conditions are actually backing up, regardless of the weekly NASS report, then the trend would turn up again. It is also important to note that the 12 cent carry level still reflects a neutral level of roughly 60% of the total cost of carry (total cost of holding the cash commodity in commercial storage).
Seasonally, the five-year index for December corn (not shown) shows the contract tends to rally through the weekly close the final week of August, gaining an average of 5%. Also, December corn's weekly close of $5.00 3/4 puts it in the lower 40% of the five-year price distribution (weekly closes corn futures, not shown) meaning it could be viewed as slightly undervalued.
So having taken the December corn contract apart, what do we see in its future following the analysis of its individual factors? The path of least resistance, at least short-term, should be up. If the commercial view starts to grow slightly more bullish, and headlines spark short-term noncommercial buying interest to rebuild a small portion of their net-long futures position, weekly stochastics should reflect a strengthening uptrend despite continued high market volatility. If so the initial target area is between $5.47 3/4 and $5.76, prices that mark the 33% and 50% retracement levels of the most recent downtrend through the recent low of $4.91 1/4. Within that range is the guaranteed crop revenue insurance price of $5.65 (purple line) created by the average daily closes by the contract this past February. If the contract climbs back above this level you could see increased commercial pressure as producers make forward sales.
To track my thoughts on the markets throughout the day, follow me on Twitter: www.twitter.com\DarinNewsom


Comments
To comment, please Log In or Join our Community .