Fundamentally Speaking
Can U.S. Maintain Strong Corn Export Sales?
Note that USDA is looking for our corn exports to fall at least 250 million bushels (mb) below last year's level based on world corn output up 80.6 million tonnes this season with Argentine, Brazilian, Russian and Ukrainian production accounting for 45.3 million tonnes (1.785 billion bushels [bb]) and these are the major exporters that have taken market share away from the U.S. really over the past two decades.
We think the real key for exports is whether Chinese import demand for this year is closer to the USDA's World Ag Outlook Board figure of 26 million tonnes, equal to the year ago levels or closer to the USDA Beijing attaché figure of 20 million tonnes.
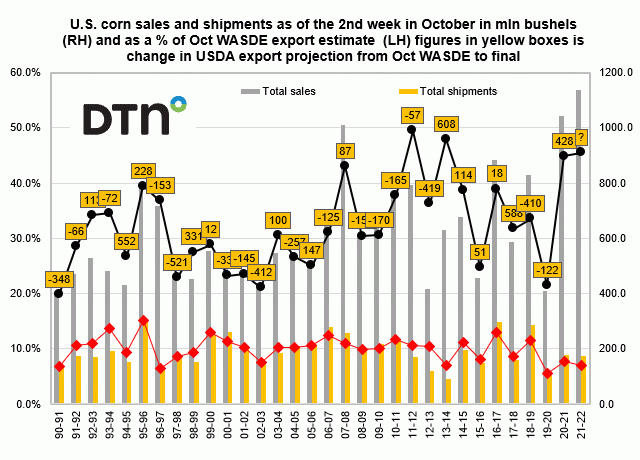
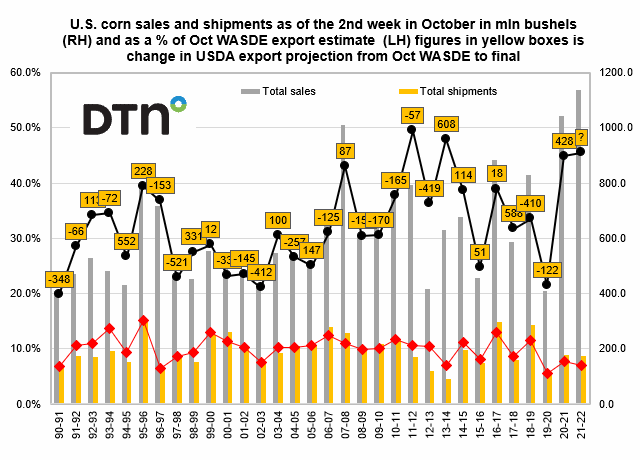
So far things look good as seen in this graphic that shows U.S. corn sales and shipments as of the second week in October in million bushels on the right-hand axis and as a percentage of the October WASDE export estimate on the left-hand axis.
The figures in the yellow boxes are the change in USDA's export projection from that October WASDE to final estimate in million bushels.
P[L1] D[0x0] M[300x250] OOP[F] ADUNIT[] T[]
This year's cumulative sales total through the second week of October is 1.137 bb, the highest ever with the year ago 1.043 bb second and the 1.012 bb in the 2007/08 marketing year third.
This is 45.5% of the revised USDA 2021/22 export projection of 2.50 bb that was raised 25 mb reflecting larger supplies and expectations of reduced competition from other major exporters earlier this month.
This is a very impressive early season figure, above the 44.9% pace seen a year ago but only the third highest percent since at least 1990 surpassed by the 47.9% figure the second week of October 2013 with a 49.5% number in October 2011 as the highest.
Shipments expressed in total bushels or percent of October WASDE export figure are rather low relative to recent years, but exports are usually focused more on soybeans at the start of the marketing year.
Does the fact that we have sold close to half our projected export total a mere six weeks into the season portend a higher USDA export projection down the road?
Certainly that was the case a year ago as final 2020/21 exports proved to be 428 mb higher than estimated back in October 2020 and the brisk pace seen in the 2013/14 season resulted in final exports that year a massive 608 mb higher than projected in October 2013.
In the 2011/12 season where our sales as a percent of the October WASDE export projection were the highest ever, the quantity of corn the U.S. exported slowed dramatically as the final figure that year was 57 mb below the October 2011 projection.
Going forward attention will be paid to internal Chinese prices relative to world values to see if current sales on the books are cancelled, how corn crop prospects develop in South America and how feeding margins in China impact demand for imported corn and if other ingredients displace corn in their feed rations.
(c) Copyright 2021 DTN, LLC. All rights reserved.


Comments
To comment, please Log In or Join our Community .