

Fundamentally Speaking
History Suggests Dec Corn Will Be Lower on 11/30/21 Than 6/30/21
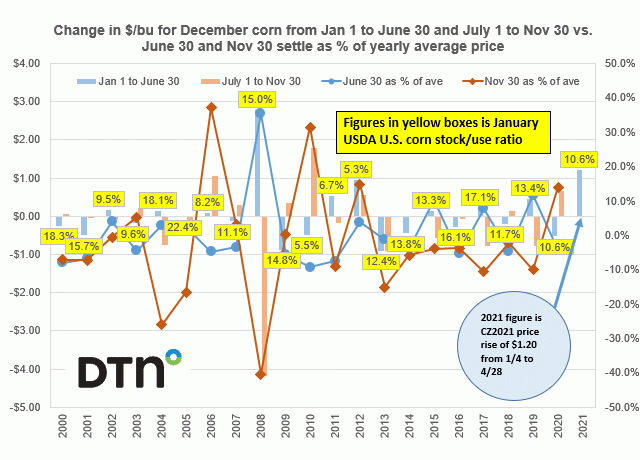
If history is any guide, December 2021 corn will see more negative price action the second half of this year (let's say from July 1 to November 30) than was seen the first half of the year going from January 1 to June 30.
The question is whether in fact this typical pattern plays out and from what level as of June 30 will prices retreat.
The graphic shows the change in dollars per bushel for December corn from around January 1 to around June 30 and then from around July 1 to around November 30 on the left-hand axis.
P[L1] D[0x0] M[300x250] OOP[F] ADUNIT[] T[]
On the right-hand axis we plot the June 30 and November 30 settle as a percent of the yearly average price.
In order to discern different semi-annual price patterns based on whether corn stocks are tight or ample, the USDA's January WASDE corn stocks-to-use ratio is also reported in the yellow boxes and the data covers the 2000 to 2020 period.
For the first half of the year prices tend to average three cents higher as of 6/30 compared to 1/1 with the largest gains of $2.77 seen in 2008 and the largest decline of 91 cents in 2013.
Note that the current gains for this year's December corn from the start of the year till 4/28 of $1.20 is the second highest next to the 2008 jump but we still have two more months to go until June 30 so who knows what will happen.
For the second half of the year, December corn averages 18 cents lower on 11/30 as opposed to 7/1 with the largest decline also in 2008; after a huge rally the first half of the year, prices plunged by $4.19/bu the second half of the year while conversely the largest gain was in 2010 of $1.79/bu.
Over the past 20 years the June 30 price settle tends to be about even with the yearly average price while the November 30 settle averages 2.5% below the average annual price.
12 out of the 20 years, December corn has fallen from July 1 to November 30 and 14 out of 20 years the 11/30 price is below the yearly average.
Interesting to note that since 2006 December corn has been up both the first and second half of the year only once back in 2012.
(c) Copyright 2021 DTN, LLC. All rights reserved.
Comments
To comment, please Log In or Join our Community .