

Fundamentally Speaking
Changes in Corn Output, Feed Usage & Stocks

Therelease of the December WASDE report was a rather sleepy affair with the grain and oilseed markets showing little reaction to numbers that for the most part were well-anticipated.
The December WASDE is one of the least influential reports of the year and the markets were pre-occupied with the resumption of Chinese purchases of various U.S. agricultural products.
January's WASDE will be different however as a number of key government reports will be issued on January 11.
The January WASDE will incorporate the final 2018 crop production figures and the quarterly grain stocks in all positions numbers with the 2019 winter wheat seedings data also to be released that day.
P[L1] D[0x0] M[300x250] OOP[F] ADUNIT[] T[]
The corn market will pay keen attention to these reports, especially in relation to the current USDA feed/residual 2018/19 projection of 5.50 billion bushels (bb) which is up 3.8% from the year ago figure and would be the highest feed usage since the 2007/08 season.
In recent years, lofty USDA feed projection figures issued early in the marketing year have had to be phased on back as quarterly corn stocks reports have indicated less consumption in this category than estimated.
As we have noted in prior posts, the quarterly stock reports are the only way the trade can get some semblance of what feed demand is.
Exports and food-seed-industrial (FSI) usage is tracked on a monthly or even weekly basis, yet the feed/residual component is a figure that is backed into by taking the stocks numbers (Sep 1, Dec 1, Mar 1 and June 1) and subtracting the known export and FSI use.
The December 1 stocks figure is further complicated by the release of the final crop production report of the year the same day along with questions about how much corn is in transit and how much is in on-farm storage; accuracy is less than certain compared to off-farm supplies.
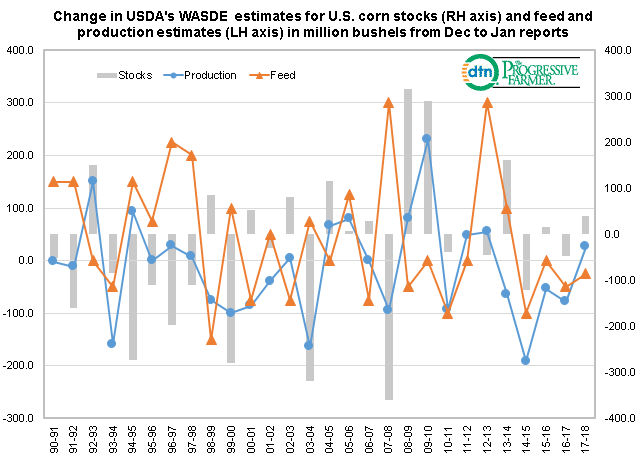
All of this can result in large changes in USDA feed, production and ending stock estimates between the December and January WASDE reports as indicated in this graphic showing changes in ending stocks on the right hand axis and revisions in feed and production on the left hand axis, all in million bushels.
Heading into these reports it appears that production will be lowered given expectations that less than ideal weather the second half of the harvest will result in a lower final yield, and since 1990 output has been lowered by an average of 12 mb with feed usage about 43 mb higher.
With the average stock decline of 30 mb, this suggests that export revisions are quite rare from the December to January WASDE reports.
A final note is there is a 50% correlation between changes in ending stocks and production and also a 50% correlation between the stock change and feed usage revisions.
(KA)
Comments
To comment, please Log In or Join our Community .