

Fundamentally Speaking
USDA Soybean Yield Revisions

In its first field based crop production report, USDA pegged the 2018 U.S. soybean yield at 51.6 bushels per acre (bpa).
This is the highest August yield estimate ever made by USDA, topping the August 2017 projection of 49.4 bpa but it is not above the highest final yield estimate of 52.1 bpa set in 2016.
Now the debate can start about whether this year's initial yield forecast will increase given ideas that "big crops get bigger', or will that 51.6 bpa projection be the highest of the year?
Some feel that the advanced state of the crop in terms of the percent of the plants first putting on flowers, then in the pod setting stage and now in the pod filling stage is like corn, so accelerated relative to past years that the crop is maturing too fast at the expense of final yields.
P[L1] D[0x0] M[300x250] OOP[F] ADUNIT[] T[]
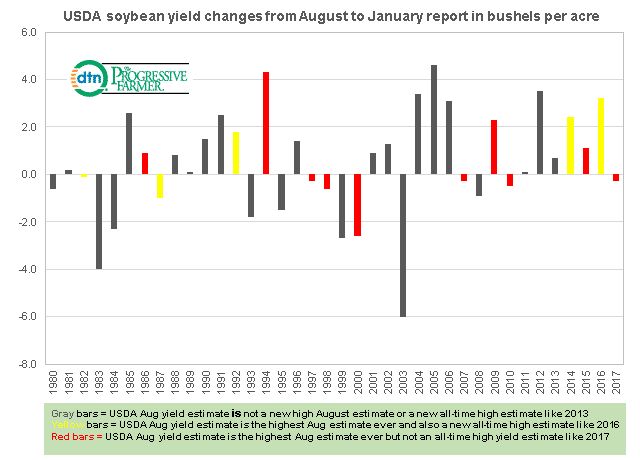
As we did in corn earlier, this chart shows USDA national soybean yield changes from the August report to the final report given in January in bpa.
The gray bars represent years where the USDA August yield estimate is not a new high August estimate or a new all-time high estimate like 2013.
The yellow bars represent where USDA August yield estimate is both the highest August estimate ever and also a new all-time high estimate like 2016.
The red bars represent where USDA August yield estimate is the highest ever August estimate ever but not an all-time high yield estimate like 2017.
In looking at the data from 1980 to 2017, the average change for these 38 years was an improvement from the August estimate to the final report in January of 0.5 bpa.
Of the 38 years, 16 times the yield fell from the August estimate to the final by an average of 1.6 bpa and increased 22 times by an average of 1.9 bpa.
Where the initial August yield estimate is both the highest August ever and a new all-time high projection, which are the yellow bars, this has happened five times with an average yield revision of up 1.3 bpa with the USDA actually seeing the final yield lower twice by an average of 0.6 bpa.
Three times the final yield is higher than what is already projected as a record the yield has increased by an average of 2.5 bpa.
For the red bars where USDA August yield estimate is the highest August estimate ever but not an all-time high yield estimate, this has happened ten times with an average yield increase of 0.4 bpa with downward revisions seen five of those years by an average of 0.9 bpa, while the other five years the yield rose by an average of 2.2 bpa.
Since this year would be designated with a red bar, it is a 50-50 propisition as to whether the final yield will be higher or lower than the August 2018 USDA projection of 51.6 bpa.
(KA)
Comments
To comment, please Log In or Join our Community .