

Fundamentally Speaking
Soybean Price Volatility at Multi-Year Lows
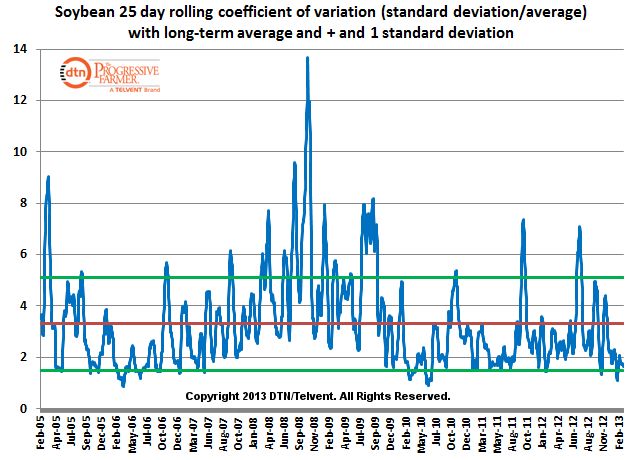
Despite the gyrations in soybean futures over the past few weeks, the volatility of prices as measured by the coefficient of variance (CV) has fallen to a multi-year low.
This graphic plots the 25 day moving average of the CV which is the 25 day standard deviation divided by the 25 day moving average times 100.
The higher the number the more variability or volatility of the market. Also included is the average and plus and minus one standard deviation of the 25 day moving CV.
The current soybean CV is 1.66, which is not that far from the minus one standard deviation line at 1.50 and a month ago, the CV actually fell below this line.
Values under this line only occur 16% or less of the time covered indicating that these are very low levels of variance.
For trading purposes, this may be a good time to be an option buyer of either an outright call or put or perhaps both via an option strange.
Recall that part of an option’s premium value is the volatility component embedded in the price of the option with lower volatility resulting in lower priced premiums than otherwise would be the case assuming all other factors such as time remaining, relation to underlying strike price, and interest costs are the same.
(KA)
P[L1] D[0x0] M[300x250] OOP[F] ADUNIT[] T[]

Comments
To comment, please Log In or Join our Community .