
Fundamentally Speaking
Avg Sep-Nov Dec Corn Price vs. Corn Feed Use
The USDA will release a number of reports January 11th including the annual crop production, the first 2013 U.S. winter wheat seedings, the monthly supply-demand figures, and the quarterly grain stocks report as of December 1st.
Of these, the quarterly corn stocks report may be of the most interest for this will be the first time the trade will be furnished information on how corn feed demand is faring for the 2012-13 season.
Abysmal weekly export sales and flagging ethanol production levels show how record high corn prices have pared demand in those two sectors but feed use can only be monitored via these quarterly reports.
P[L1] D[0x0] M[300x250] OOP[F] ADUNIT[] T[]
Reports of poor feeding margins amid falling animal and bird numbers suggest a drop in Sep-Nov corn feed use relative to past years and this is already reflected in the USDA’s feed projection for this year at 4.150 billion bushels, the lowest figure since the 1988-89 season.
Note the Sep-Nov 2011 corn feed use at 1.823 billion bushels was the lowest since 1.778 billion bushels were consumed in the Sep-Nov 1995 period.
Over the past ten years, the percent of annual corn feed use in this period consumed ranged from 35.3 to 43.1% averaging 38.5%.
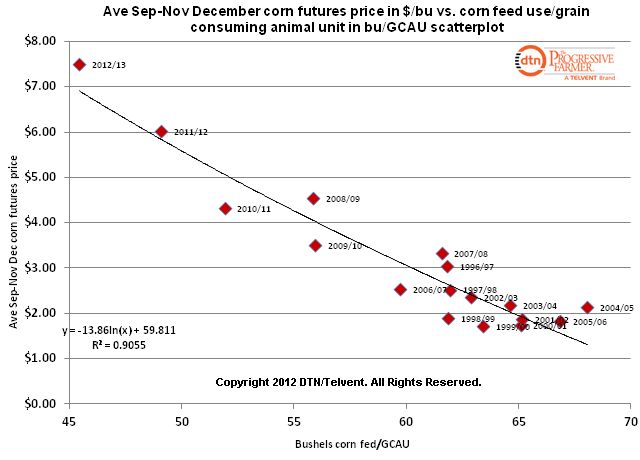
This graphic is a scatter plot showing the average amount of corn fed per grain consuming animal unit (GCAU) vs. the average Sep-Nov December corn futures price in $/bushel.
The USDA has estimated the 2012-13 GCAU numbers at 91.31 million, the lowest total since the 2004/05 season.
With feed use projected at 4.150 billion bushels this works out to 45.5 bushels of corn fed/GCAU.
This is the lowest figure we have in our database and goes hand in hand with the record high December corn futures seen in the just passed Sep-Nov quarter.
In fact, the logarithmic trend-line shows a very defined inverse relation between corn feed use/GCAU and prices with a high R squared of 91%.
Rearranging terms to solve for x results in a corn fed/GCAU figure of 43.5 which if multiplied by this year’s GCAU of 91.31 million yields an annual feed figure of 3.975 billion bushels, 175 million less than what the USDA is projecting.
(KA)

Comments
To comment, please Log In or Join our Community .