

Technically Speaking
Weekly Analysis: Corn and Soybean Markets

Corn (Cash): The DTN National Corn Index (NCI.X, national average cash price) closed at $3.30 3/4, up 5 3/4 cents for the week. The NCI.X moved to a secondary (intermediate-term) sideways trend on its weekly close only chart. The higher weekly close allowed weekly stochastics to post a bullish crossover, though well above the oversold level of 20%. Initial support remains at the recent low weekly close of $3.17 1/4 with resistance the recent high weekly close of $3.35.
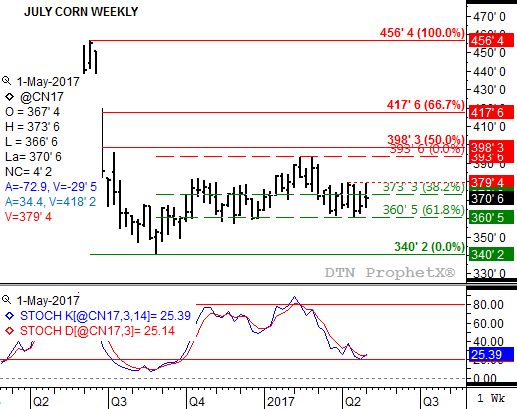
Corn (Old-crop Futures): The July contract closed 4.25cts higher at $3.70 3/4. The secondary (intermediate-term) trend remains sideways with initial support at $3.60 1/2 and resistance at the 4-week high of $3.79 1/2. Based on the 19 cent sideways range, a move through resistance would indicate an extended rally to test resistance at $3.98 1/4 while a move through support implies a retest of the low at $3.60 1/4.
P[L1] D[0x0] M[300x250] OOP[F] ADUNIT[] T[]
Corn (New-crop Futures): The December 2017 contract closed 3.50cts higher at $3.88 1/2. The contract's secondary (intermediate-term) trend remains sideways with initial support near $3.81 1/4, then $3.73 1/2. Resistance is at the 4-weeek high of $3.95 3/4, then $4.03 3/4.
Soybeans (Cash): The DTN National Soybean Index (NSI.X, national average cash price) closed at $9.00 3/4, up 22 1/4 cents for the week. The NSI.X remains in a secondary (intermediate-term) uptrend on its weekly close only chart. Initial resistance is at $9.25, a price that marks the 23.6% retracement level of the previous downtrend from $11.12 through the low of $8.67 1/4. The 38.2% retracement level is at $9.60 3/4. Weekly stochastics are bullish below the oversold level of 20%. National average basis (NSI.X minus the close of the July futures contract) strengthened 5 cents last week.
Soybeans (Old-crop Futures): The July contract closed at $9.73, up 16 3/4 cents for the week. The contract remains in a secondary (intermediate-term) uptrend based on the bullish reversal seen the week of April 10. July beans tested initial resistance at $9.81 3/4, a price that marks the 23.6% retracement level of the previous downtrend from $11.13, with its high of $9.83. The 38.2% retracement level is up near $10.06 3/4. Weekly stochastics are bullish below the oversold level of 20%.
Soybeans (New-crop Futures): The November 2017 contract closed at $9.66 1/2, up 13 1/4 cents for the week. The contract looks to have reestablished its secondary (intermediate-term) uptrend as it posted a new 4-week high of $9.73 3/4. Next resistance is at $9.80 1/4, a price that marks the 38.2% retracement level of the previous downtrend from $10.43 through the low of $9.41 1/2.
To track my thoughts on the markets throughout the day, follow me on Twitter: www.twitter.com\DarinNewsom
Comments
To comment, please Log In or Join our Community .