Todd's Take
Comparing Current Corn Prices to Previous Rallies
The last six days of closing prices for DTN's National Corn Index (DTN's national average of cash corn prices) have been: $6.68, $6.91, $6.94, $7.12, $7.24 and $7.35.
We could go back to April 1 when the price was $5.49 or Dec. 15 when it was $4.08 or, heck, we could even go back to last year's low of $2.77 on April 28. But no matter how we look at it, this has been one astonishing ride on the corn bull, and we still don't know when the quarter is going to run out of time.
As I mentioned last week, there is a risk of market vertigo that comes with riding prices this high, this far and this fast. Those of us who have tried to take advantage of a high price along the way and watched corn prices keep rising like a helium balloon past our old sense of what's high are left asking: What is the new normal?
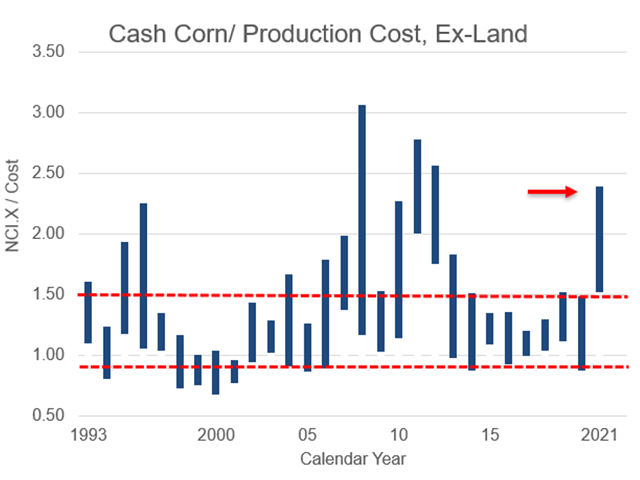
The best tool I know of for overcoming price-related dizziness and regaining sense of perspective is a historical comparison of cash corn prices with USDA's production estimates. I've often used this before as a way of bolstering hope for producers when corn surpluses were larger and cash prices would fall below $3.00.
This is the first time I've used this method as a way of assessing today's high price compared to previous peaks. DTN's National Corn Index closed at $7.35 per bushel on Thursday, May 6. I should explain, I exclude USDA's estimate of land expense, because everyone has a different farm situation and leaving it out makes for a more reliable measuring tool.
P[L1] D[0x0] M[300x250] OOP[F] ADUNIT[] T[]
The advantage of comparing prices to cost is that we don't have to worry about changes in the value of the dollar over long periods of time. The price divided by cost method has shown corn prices typically trade between 90% and 150% of the previous year's production cost.
In fact, it is interesting that the index's $2.77 low in April 2020 was at 87% of cost, very near the usual historic trough. Thursday's $7.35 close is 239% above cost, a level not seen since the drought year of 2012 when prices reached $7.69 per bushel or 256% of cost.
Going back to 1993, the highest price peak for this metric was $7.05 per bushel in 2008, representing a 306% premium over cost. It was a time when ethanol mandates sparked a boom in corn prices, occasionally enhanced by weather concerns. The previous corn price peak of $5.17 per bushel in 1996 equated to 225% of cost and is long remembered as a similar scenario of unusually large demand from China plus drought.
China in 2021, however, is a much more powerful source of demand than it ever was in 1995-96. Given the emotion of markets, uncertainty of weather and uncertainty of future demand from China, it is impossible to say with any confidence where this year's rally in corn prices will end. This is not some flaky burst of speculative emotion as noncommercial net longs have largely remained flat in corn in 2021.
Today's corn market is a representation of strong foreign and commercial demand for much smaller ending supplies of U.S. corn than most thought possible last fall. Hot and dry weather afflicting Brazil's second corn crop at pollination still offers no relief in the seven-day forecast. Friday morning's news from USDA that China bought 53.5 million bushels (mb) of new-crop corn from the U.S. is quite possibly an early bullish sign of more demand to come in 2021.
Fundamentally, this is an extremely bullish situation that deserves comparisons to the previous bull markets of 1996 and 2012. I'm not sure today's situation matches the ethanol boom of 2008, but if it did, the equivalent price for the DTN National Corn Index would be $9.41 -- a price I don't expect, but also can't rule out.
Best wishes navigating what is setting up to be a volatile year for corn prices.
**
The comments above are for educational purposes and are not meant as specific trade recommendations. The buying and selling of grain and grain futures involve substantial risk and are not suitable for everyone.
Todd Hultman can be reached at Todd.Hultman@dtn.com
Follow him on Twitter @ToddHultman1
(c) Copyright 2021 DTN, LLC. All rights reserved.


