

Canada Markets
Percent Change in Production Forecast from January to Final

On Jan. 20, Agriculture and Agri-Food Canada's Outlook for Principal Field Crops report will be released which will include the addition of supply and demand forecasts for Canada's principal field crops for the 2023-24 crop year.
This study looks at the past success of this report in estimating one component of this data, or production, for the upcoming crop year.
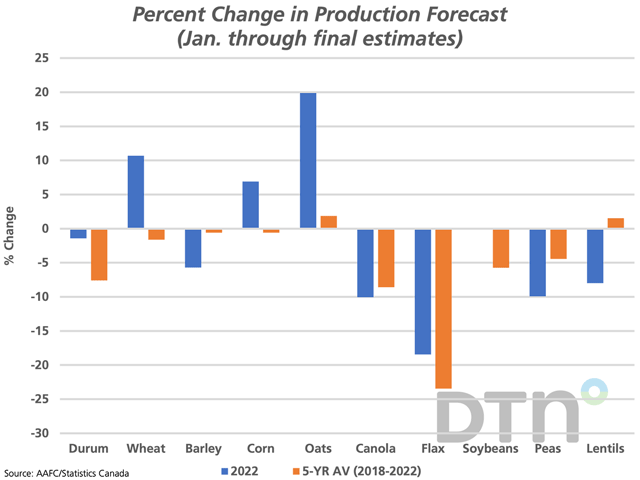
The blue bars on the attached chart indicate the percent change from AAFC's initial forecast in January to the final estimates reported by Statistics Canada, which includes any revisions that may have been reported.
P[L1] D[0x0] M[300x250] OOP[F] ADUNIT[] T[]
The extremes shown on the attached chart for the 2022-23 crop year (blue bars) range are seen in the flax and oat estimates, which compares the change from the Jan. 21, 2022 AAFC estimate to the November estimate released by Statistics Canada on Dec. 2, which is subject to revision for a two-year period. The final oat production estimate is 19.9% higher than the January forecast with the final estimate showing higher seeded acre, harvested acre and average yield. The final flax estimate released in December was 18.4% below the January estimate, with a significant drop in seeded acres off-setting a higher yield estimated in January.
Of the largest crops, the final wheat (excluding durum) estimate was 10.7% higher than estimated in January and the final canola estimate was 10% lower than estimated early in the year.
The brown bars represent the five-year average percent change from January to December, results that are significantly affected by the 2021 estimates that saw final estimates as much as 51.8% below the January estimate across the crops selected, which was the case for durum.
Of the crops shown, the five-year average percent change is pointing to higher production reported in December for only two crops. The average percent change shows the average lentil crop 1.5% larger and the average oat crop 1.9% larger than forecast in January. The other eight crops range from 0.6% lower for corn and barley to as much as 23.4% lower for flax.
One final point is the frequency in which the final estimate is higher or lower than the January forecast over the past five years. The final canola estimate has been reported lower than the January forecast in four of the past five years, averaging 8.6% lower. The final estimates for both flax and soybeans have been reported lower than the January forecast in each of the past five years, averaging 23.4% lower and 5.7% lower, respectively.
Of the seven remaining crops, the December estimate has been reported lower than the January forecast in just two of the five years for all but corn, which has been reported lower in December in three of the past five years.
Cliff Jamieson can be reached at cliff.jamieson@dtn.com
Follow him on Twitter @Cliff Jamieson
(c) Copyright 2023 DTN, LLC. All rights reserved.
Comments
To comment, please Log In or Join our Community .