Canada Markets
March 31 Grain Stocks as a Percentage of Total Stocks
As indicated in the two Statistics Canada crop reports released on May 7, both March seeding intentions and March 31 stocks, the reports were created "under exceptional circumstances" due to the COVID-19 pandemic. Some forms of data collection were suspended roughly two weeks early in March, while the agency reported that total responses are well below normal.
As with all inventory reports, a portion of the report can be deemed reliable. Commercial stocks data was derived from the Canadian Grain Commission and in the case of corn and soybeans, a combination of CGC data and from a survey conducted with eastern Canada grain elevators. As stated by Statistics Canada, commercial stocks data has not been affected by the COVID-19 pandemic.
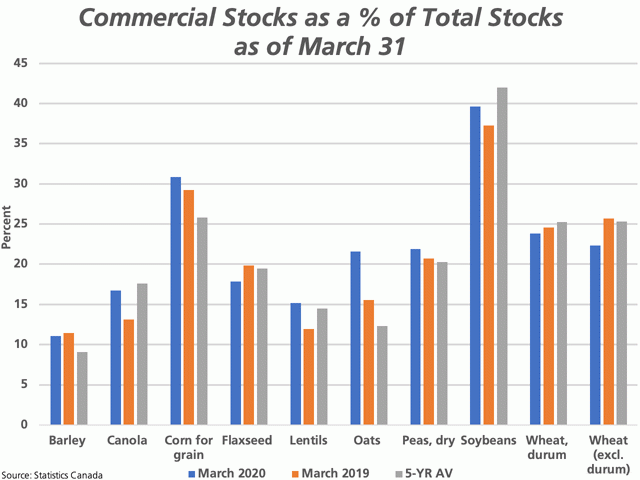
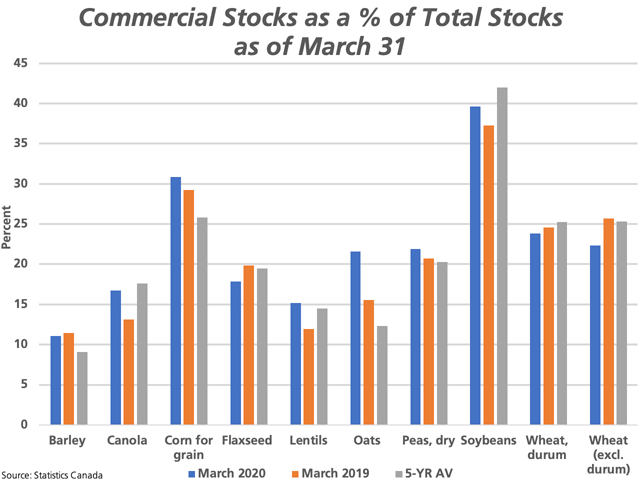
This study looks at the ratio of commercial stocks to total stocks to see if anything can be gleamed from the relationship. This calculation (P) is a result of a known quantity of commercial stocks (x) divided by this known quantity (x) added to the estimated farm stocks (y) and multiplied by 100, or P=(x/(x+y))*100.
A growing percentage over time may signal:
P[L1] D[0x0] M[300x250] OOP[F] ADUNIT[] T[]
1. Increasing prospects for trade or domestic consumption, commercials are building stocks for future sale;
2. Commercial stocks are growing unintentionally through loss of demand; and
3. The farm stocks component of the equation's denominator may be understated.
A good example is seen with soybean stocks on the attached chart. Statistics Canada reported March 31 commercial soybean stocks at 1.129 million metric tons (mmt), the second highest March 31 commercial stocks on record, which represents 39.6% of the total stocks estimate (farm plus commercial). Commercial stocks accounted for 37.2% of the total on March 31, 2019, while the five-year average is 41.9%.
It does not seem likely that the percentage of commercial stocks relative to total stocks has grown year-over--year as a result of growing demand. Crop-year exports in the September through March period are calculated at 2.585 mmt, according to Statistics Canada data, the lowest for this period in eight years, while this is the time of year that buyers turn to less expensive South American supplies.
As well, there was no sudden shock to the market that changed the outlook for Canadian soybean demand, leading to increased stocks. It is therefore conceivable farm stocks could be understated, bearish for soybeans overall.
As seen on the attached chart, grains to watch that saw a surge in this percentage that is likely demand driven and supportive for prices are canola, lentils, oats and peas.
Corn is another crop that shows bearish data in this calculation. March 31 stocks represent 31% of total stocks, which is higher than the 29% for March 2019 and the five-year average of 26%. This is seen on a year of weak export data and demand issues faced on both the ethanol sector and the feed sector. This could also be a situation where farm stocks are understated.
Cliff Jamieson can be reached at cliff.jamieson@dtn.com
Follow Cliff Jamieson on Twitter @Cliff Jamieson
© (c) Copyright 2020 DTN, LLC. All rights reserved.


Comments
To comment, please Log In or Join our Community .